1.Overview
Superset is an open-source modern data exploration and visualization platform.
Link: https://insight.galaxyedu.io/superset/welcome/
2. How to build dashboard
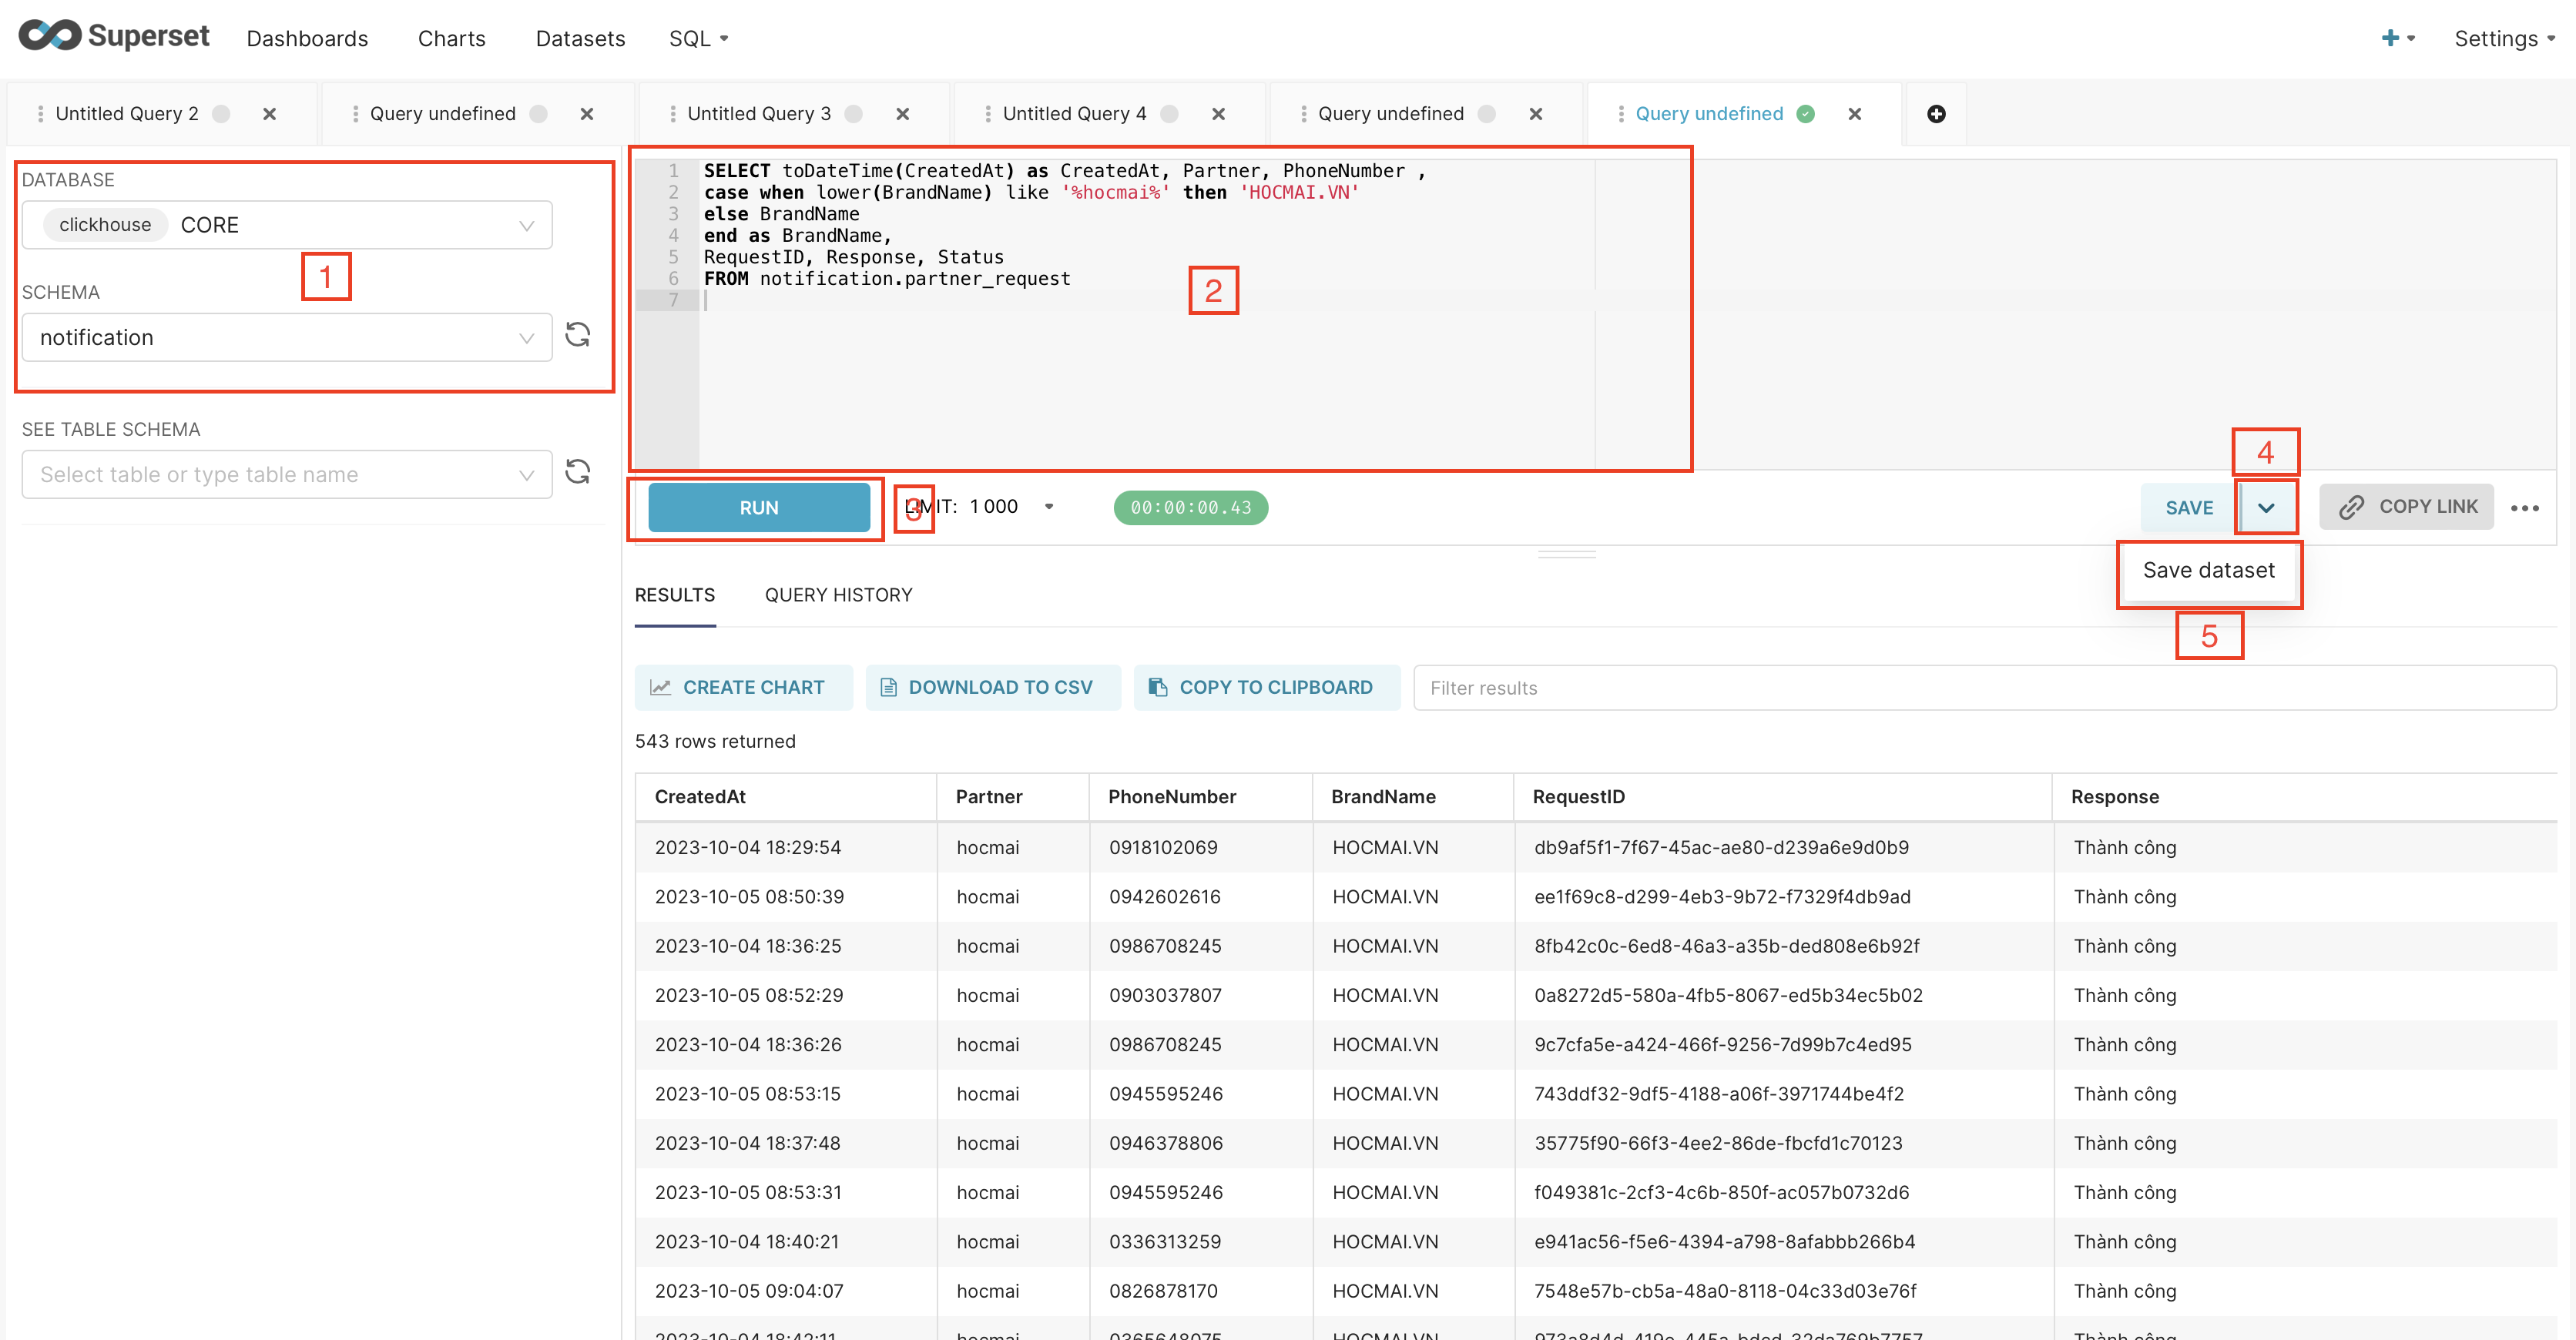
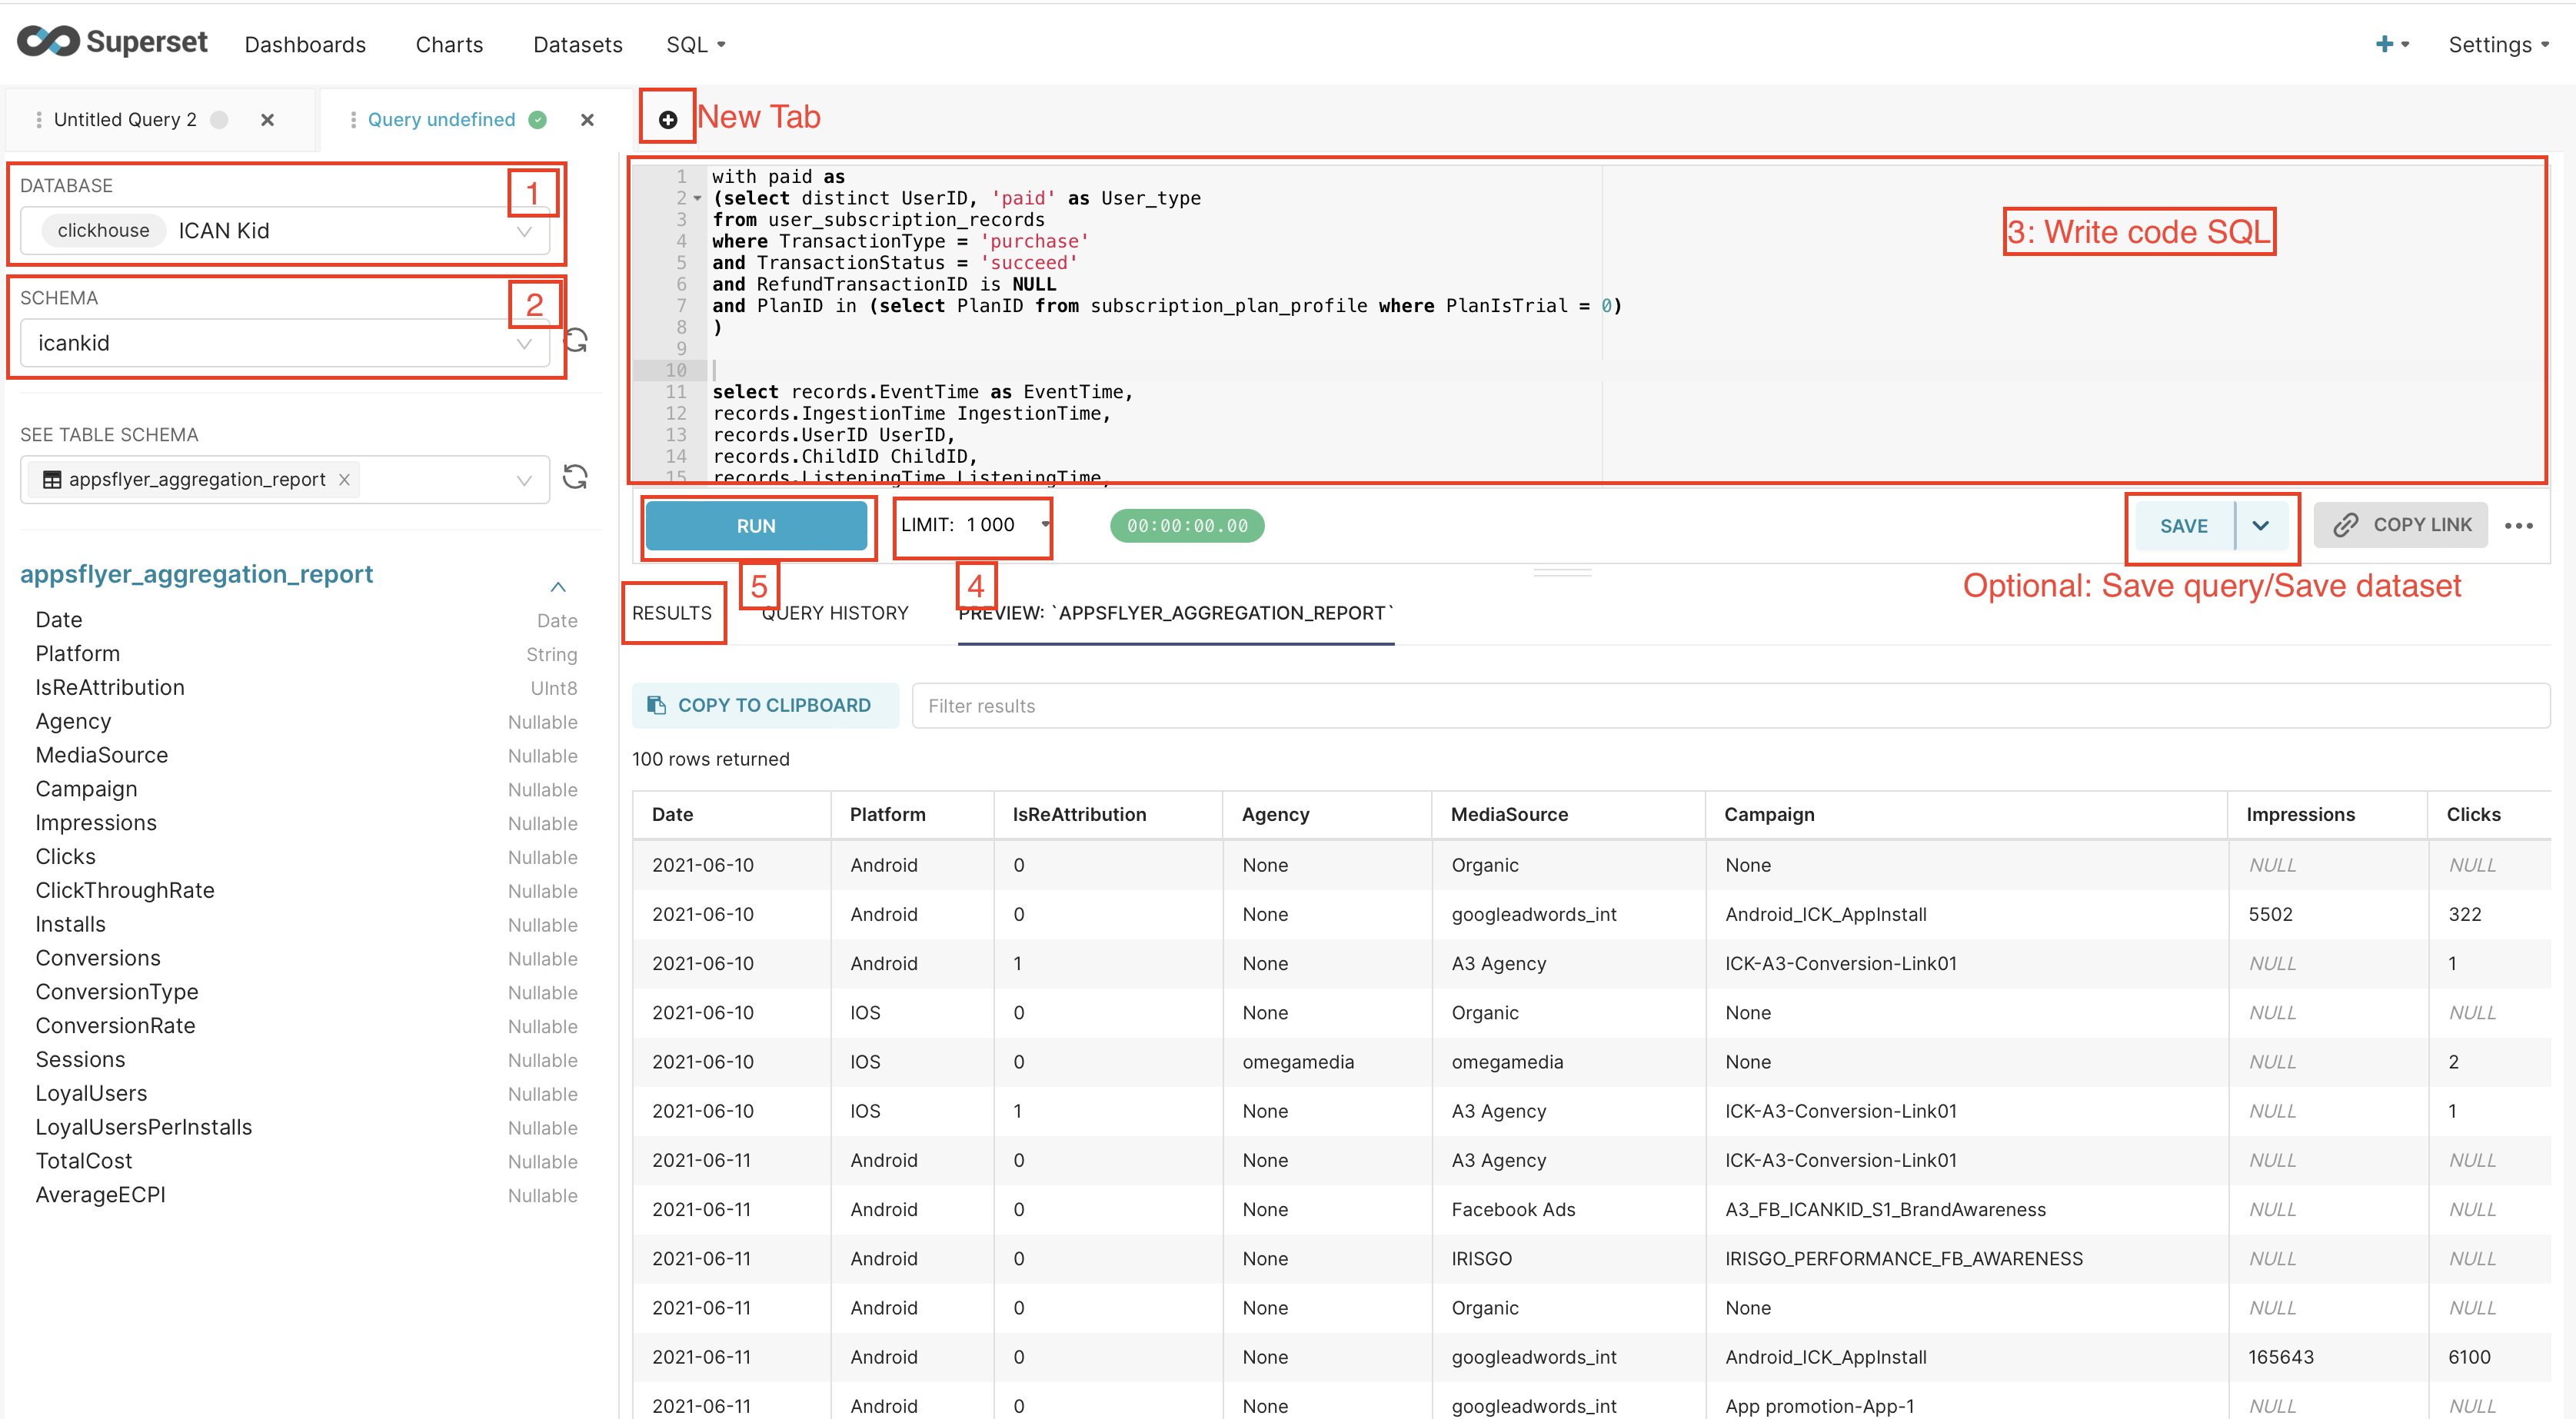
Step 1: Query to get data → Save dataset
- Choose database, schema
- Write code SQL to get data
- Run to check your result
- Click button beside "Save"
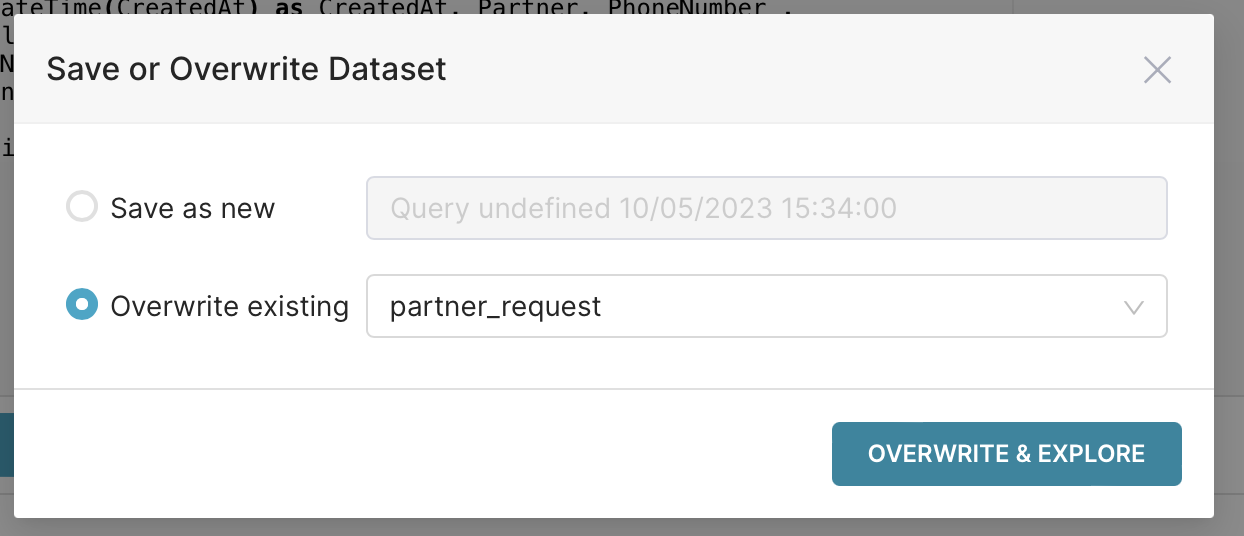
- Save dataset
- Save as new or Overwrite existing
Database | Schema | Description |
CORE | icanid | merchant, users |
icanpayment | bank transfer, billing, transaction | |
subscription | Product plan | |
ICAN Kid | icankid | |
Report | user_report | cash in, paid user 4 BUs |
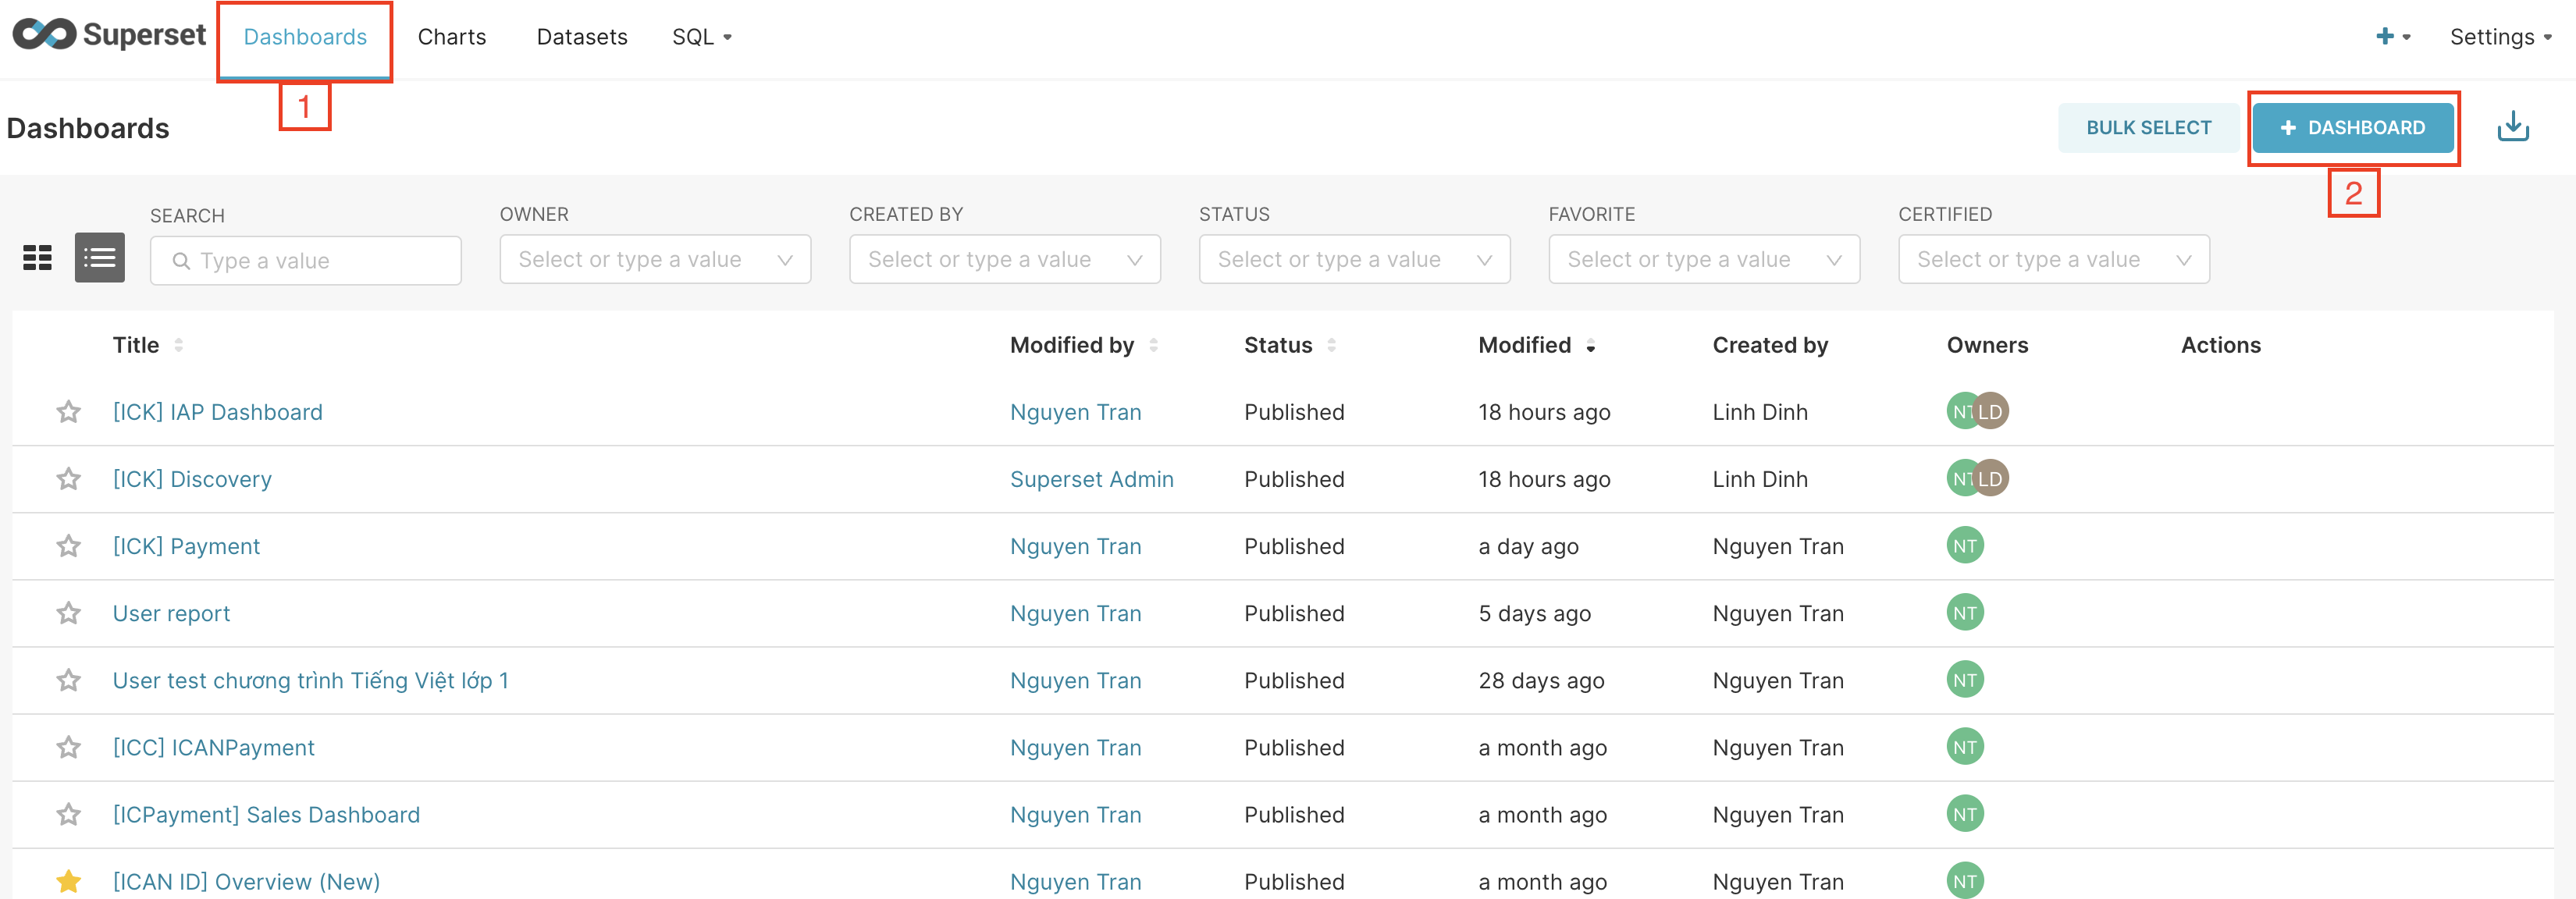
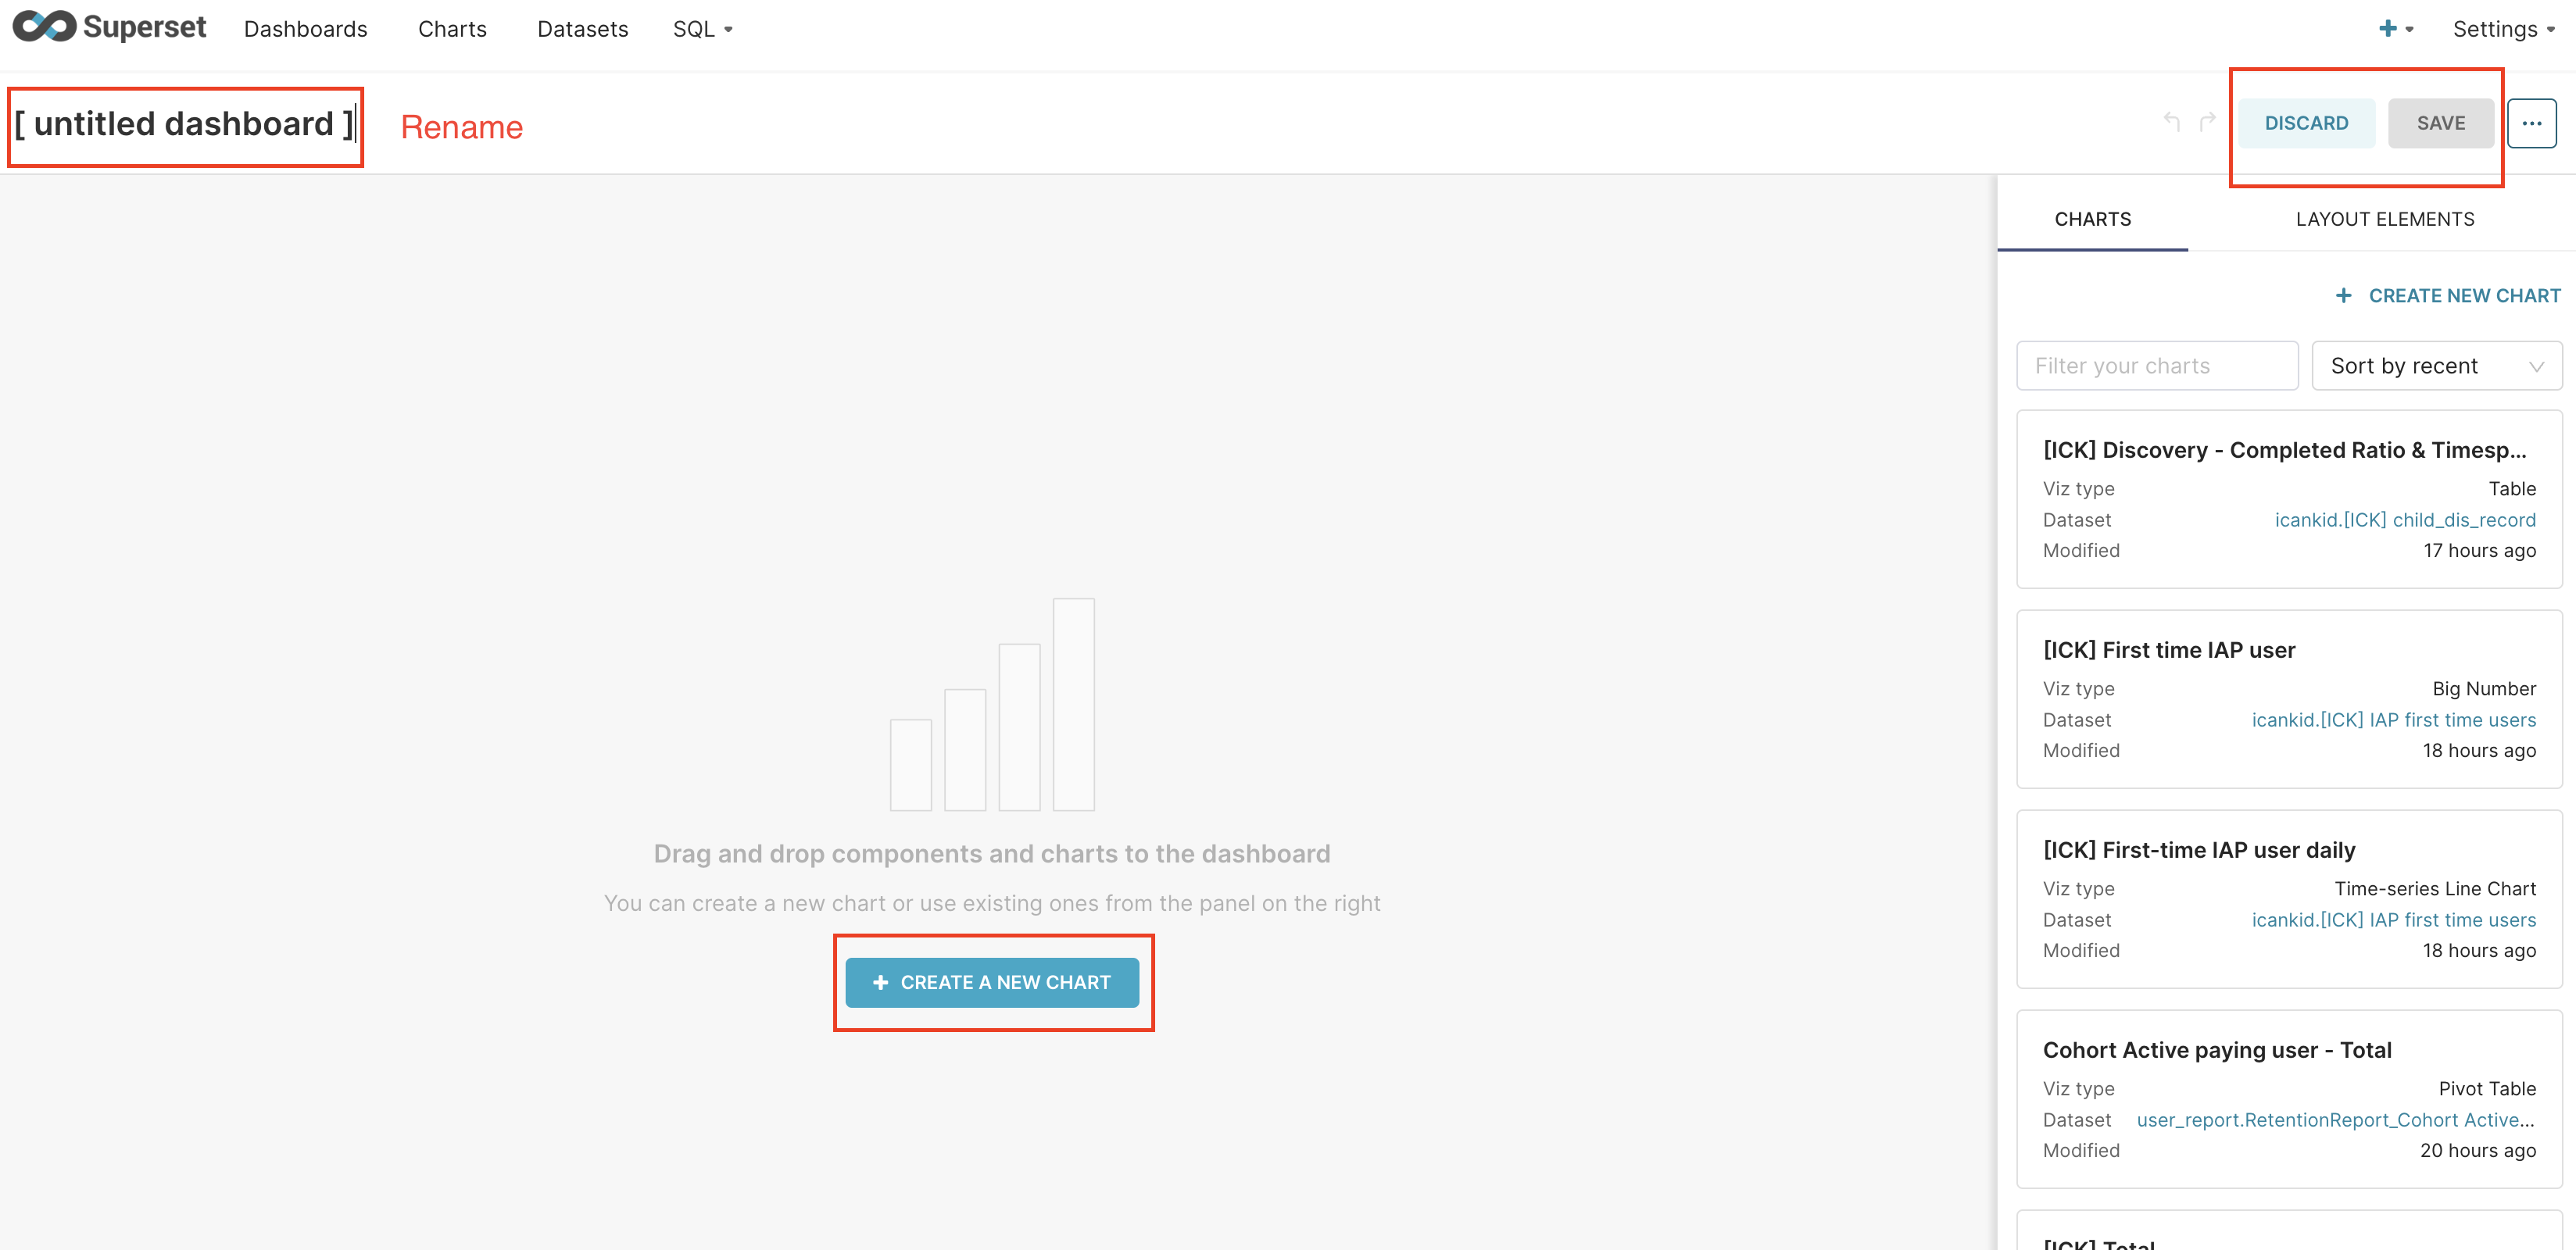
Step 2: Create dashboard
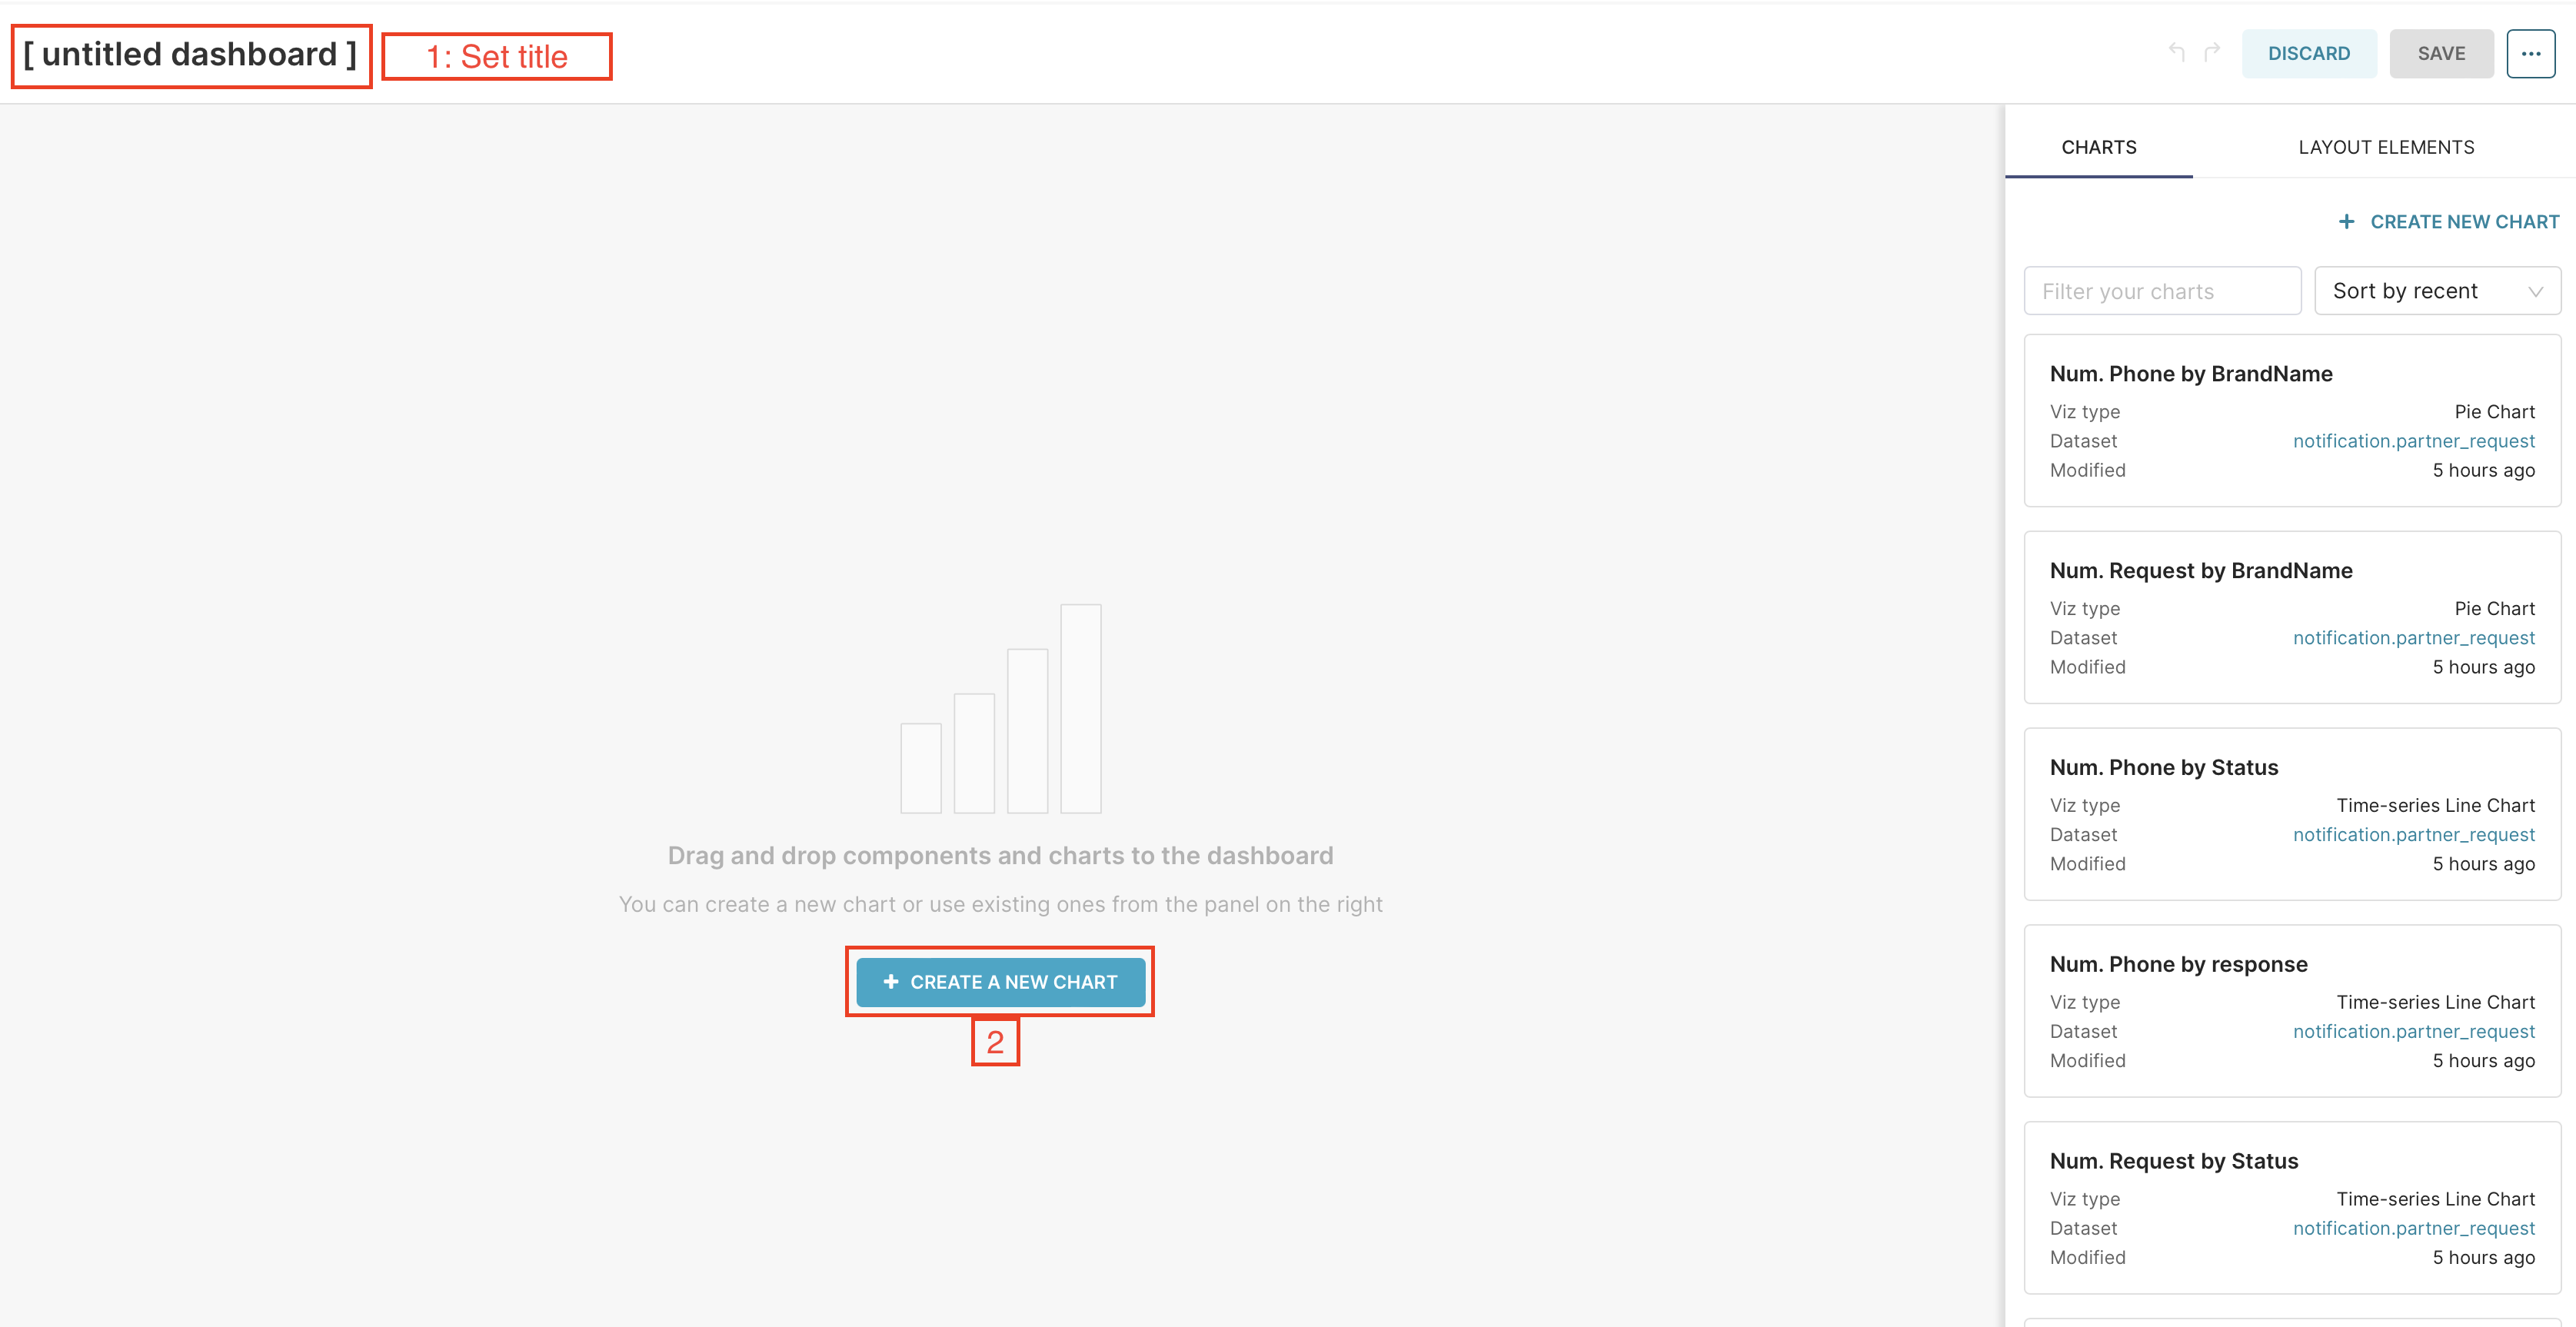
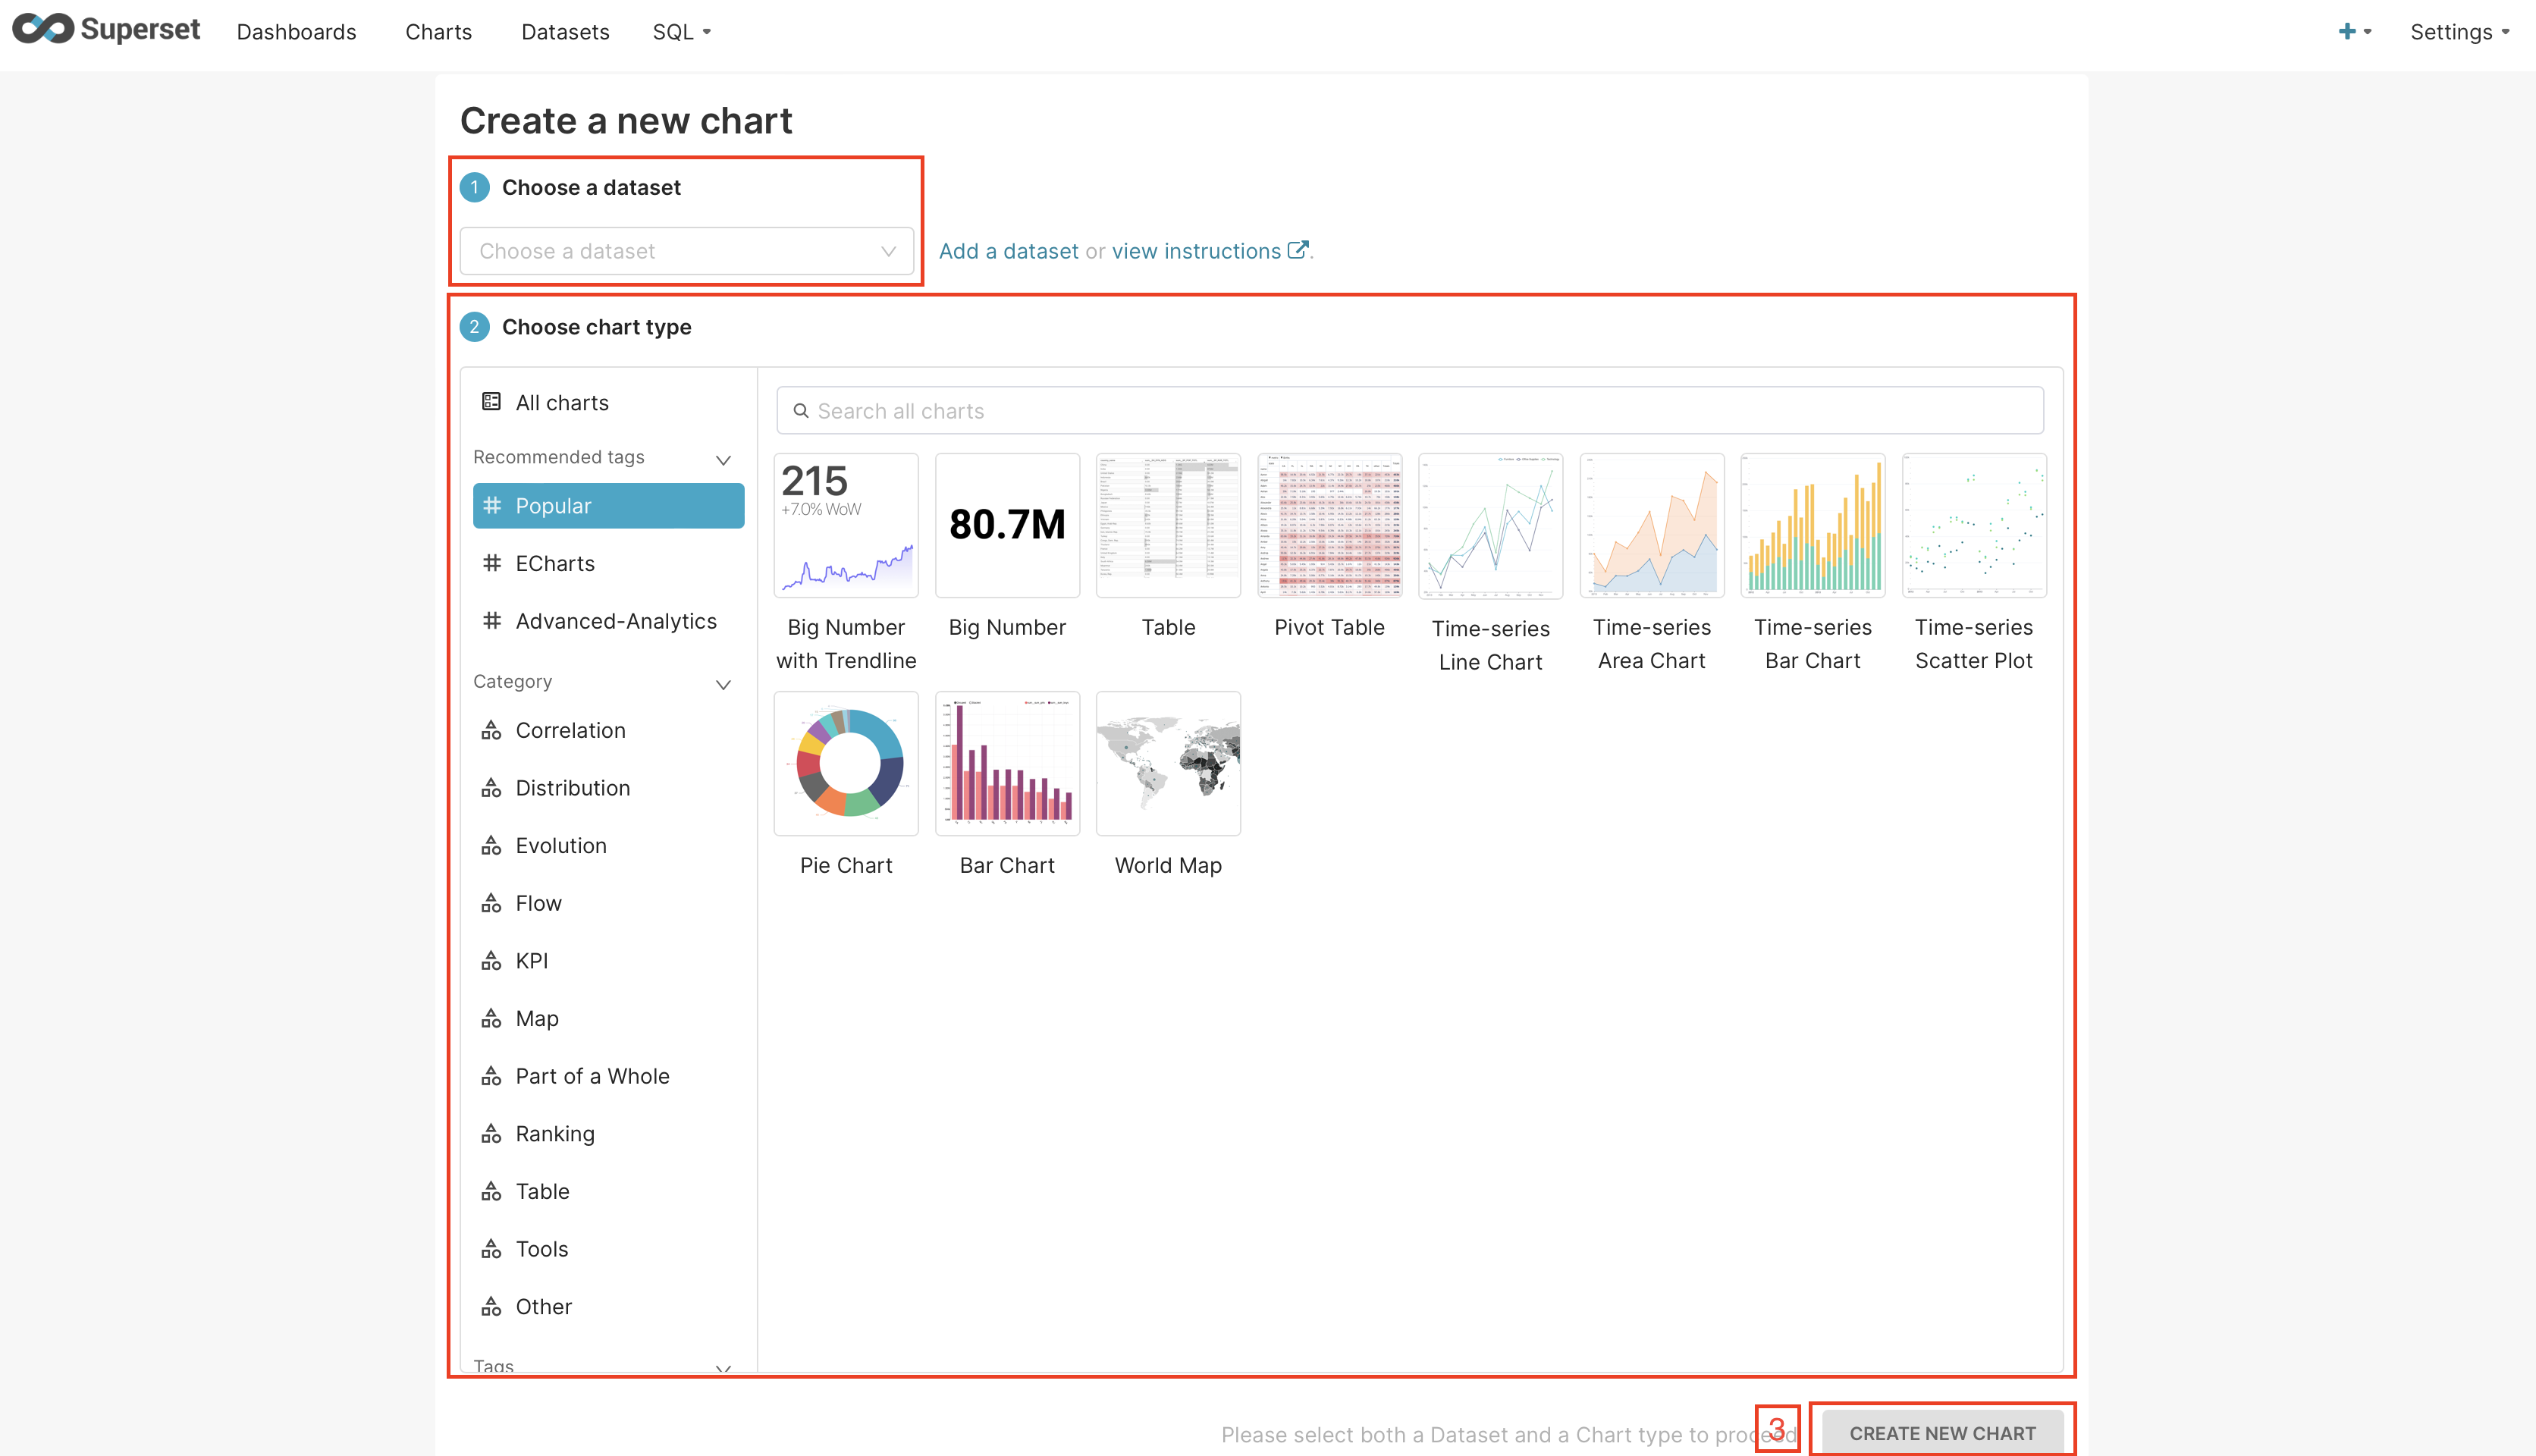
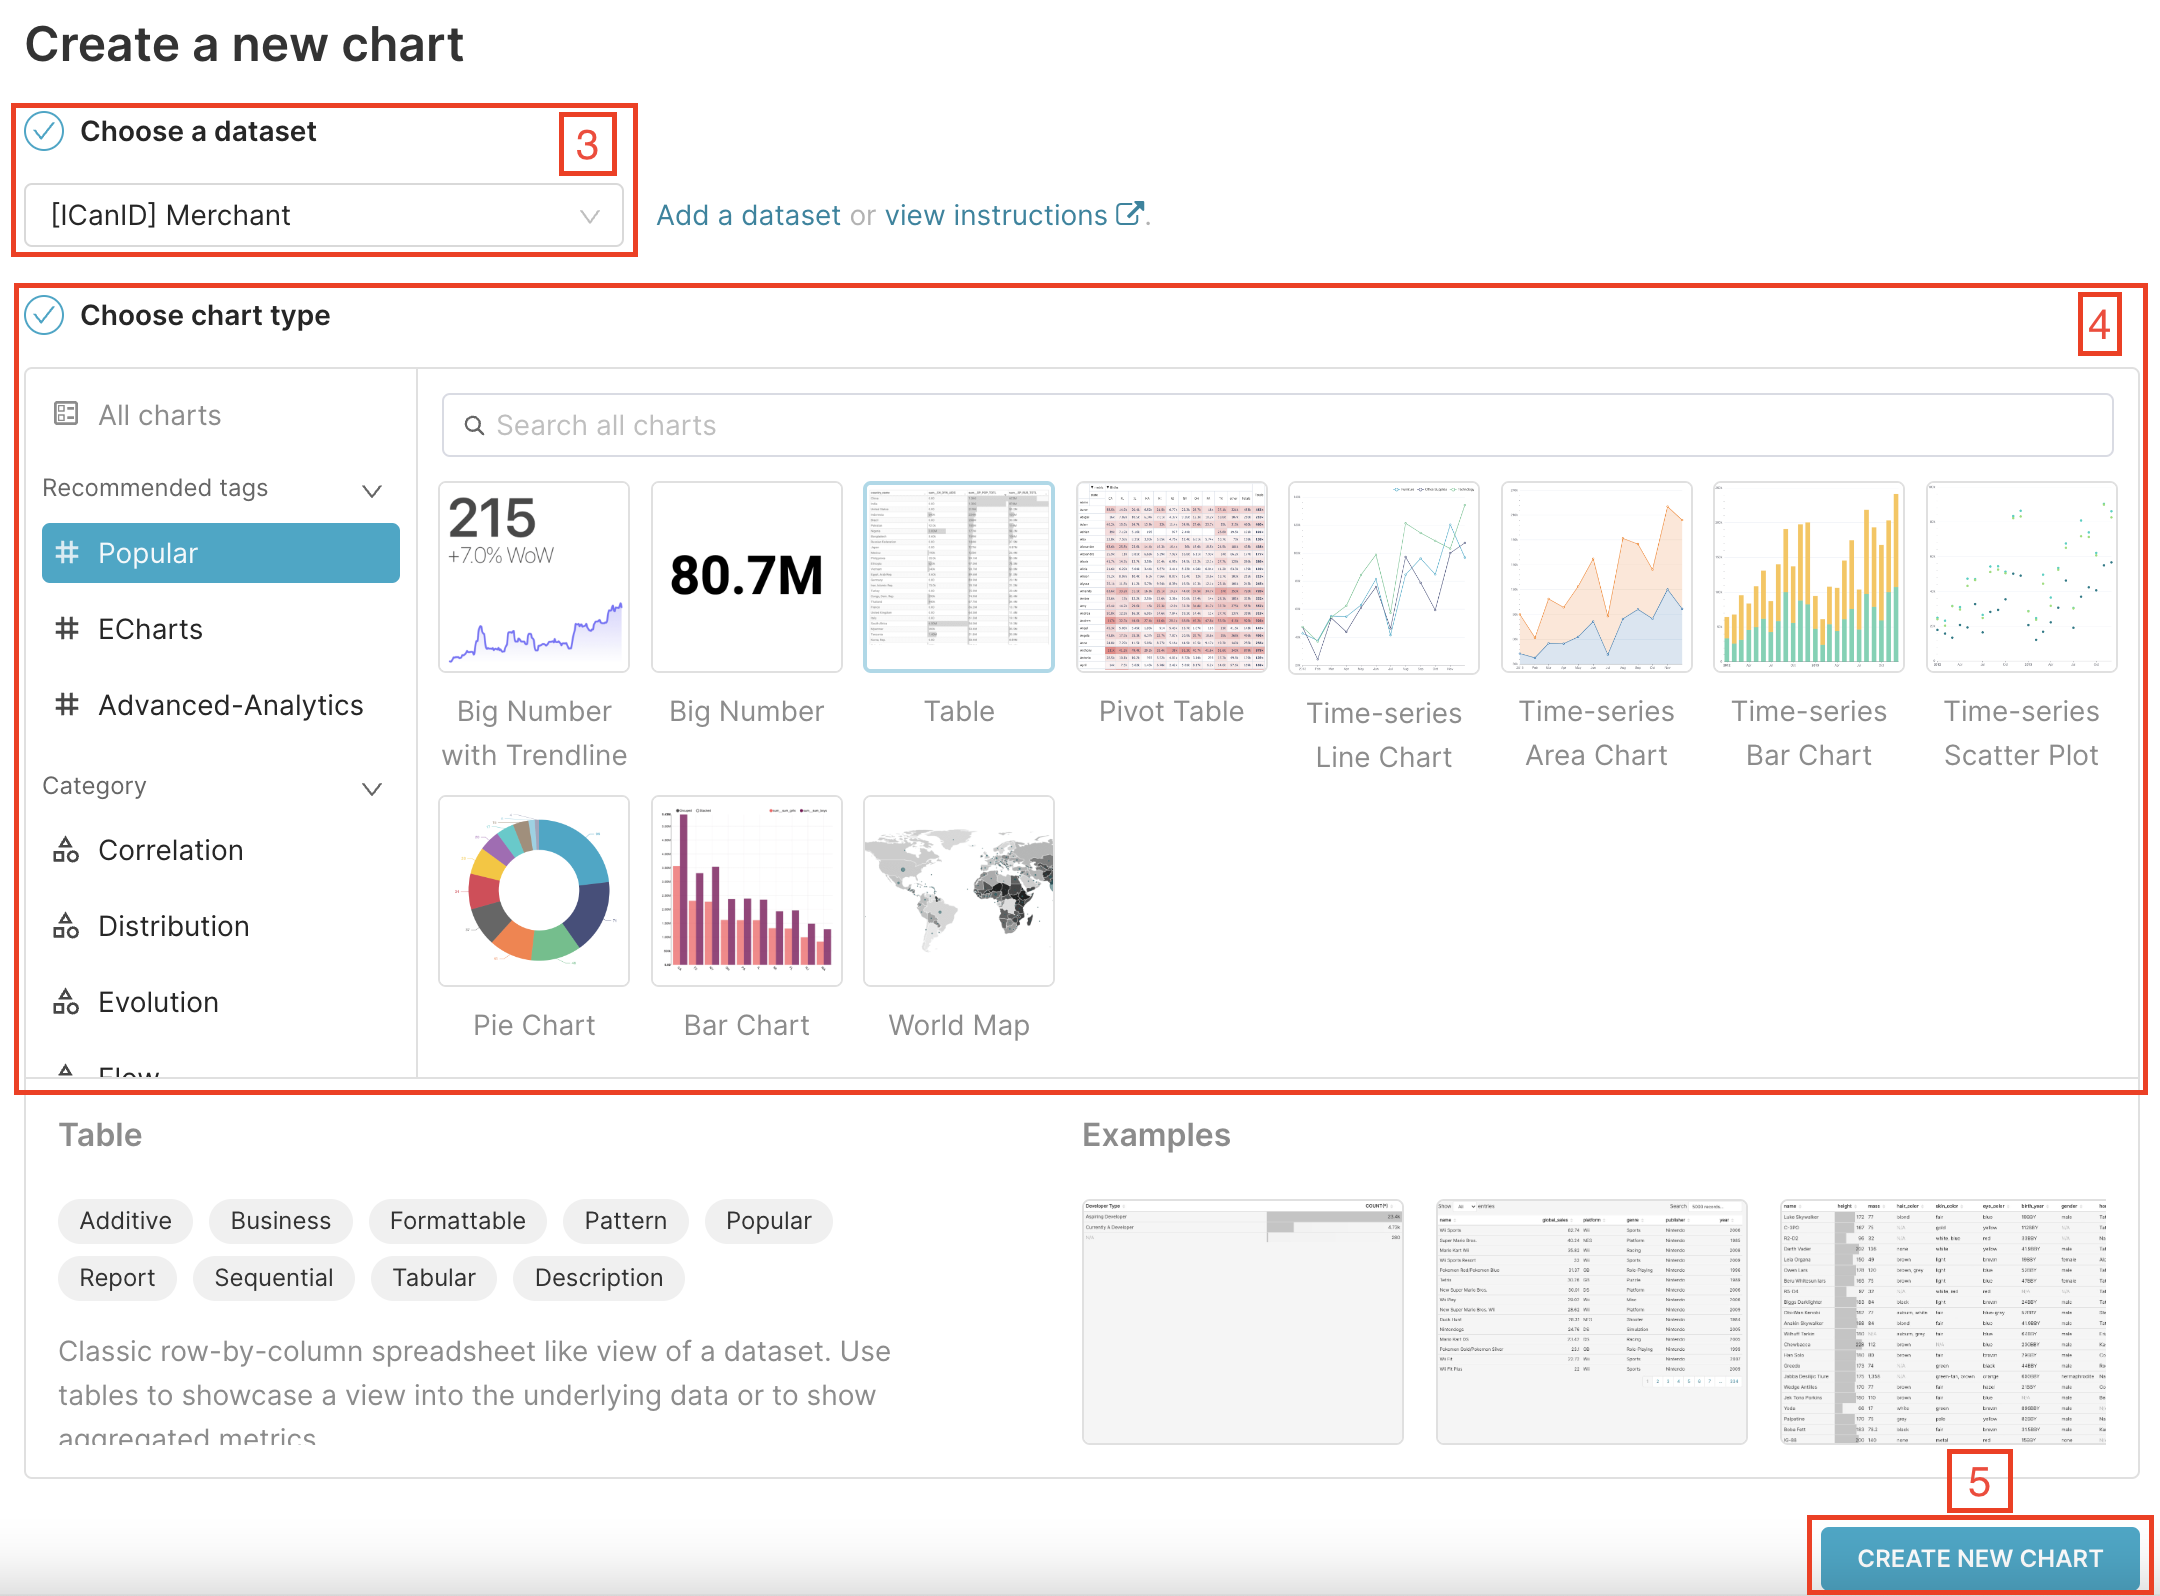
Step 3: Create new chart
- Choose a dataset (step 1)
- Choose chart type
- Click button Create New chart
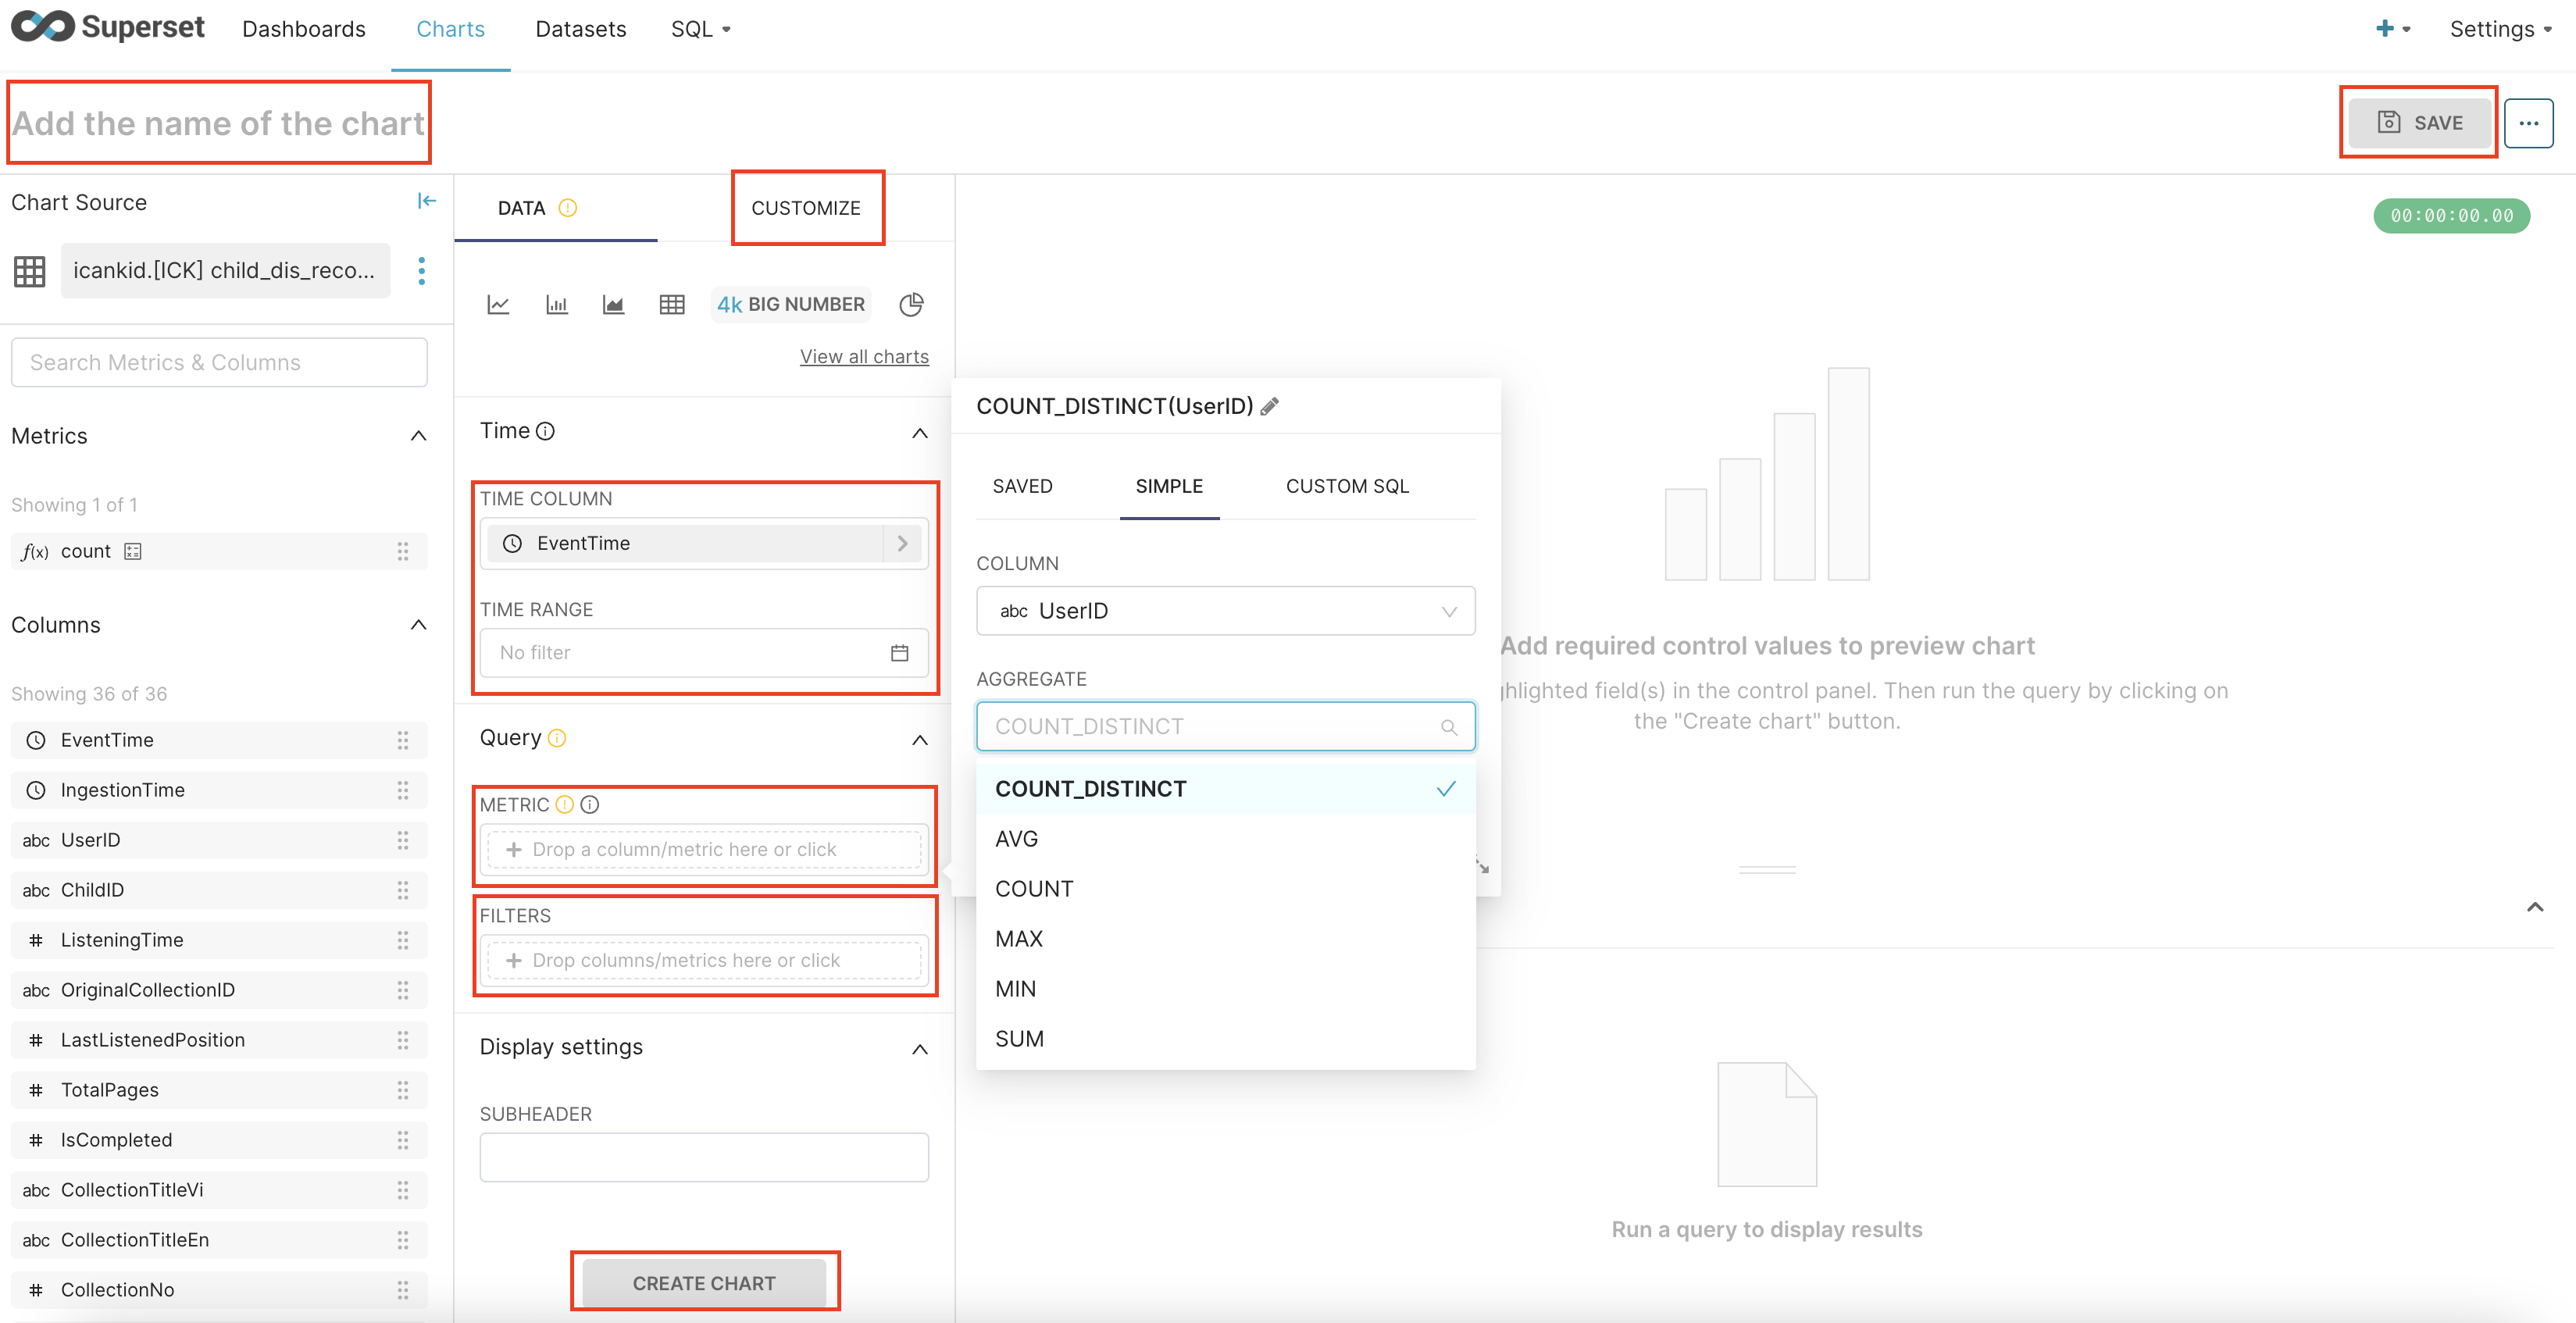
- Add the name of chart, select time range, metrics, filters,...
- Save
Step 4: Edit dashboard
- Click button Edit dashboard
- Drag and drop to edit chart size and position
- Discard or Save your chart.
Step 5: Share
Share the dashboard by generating a public or private URL, or embed it in other web applications.
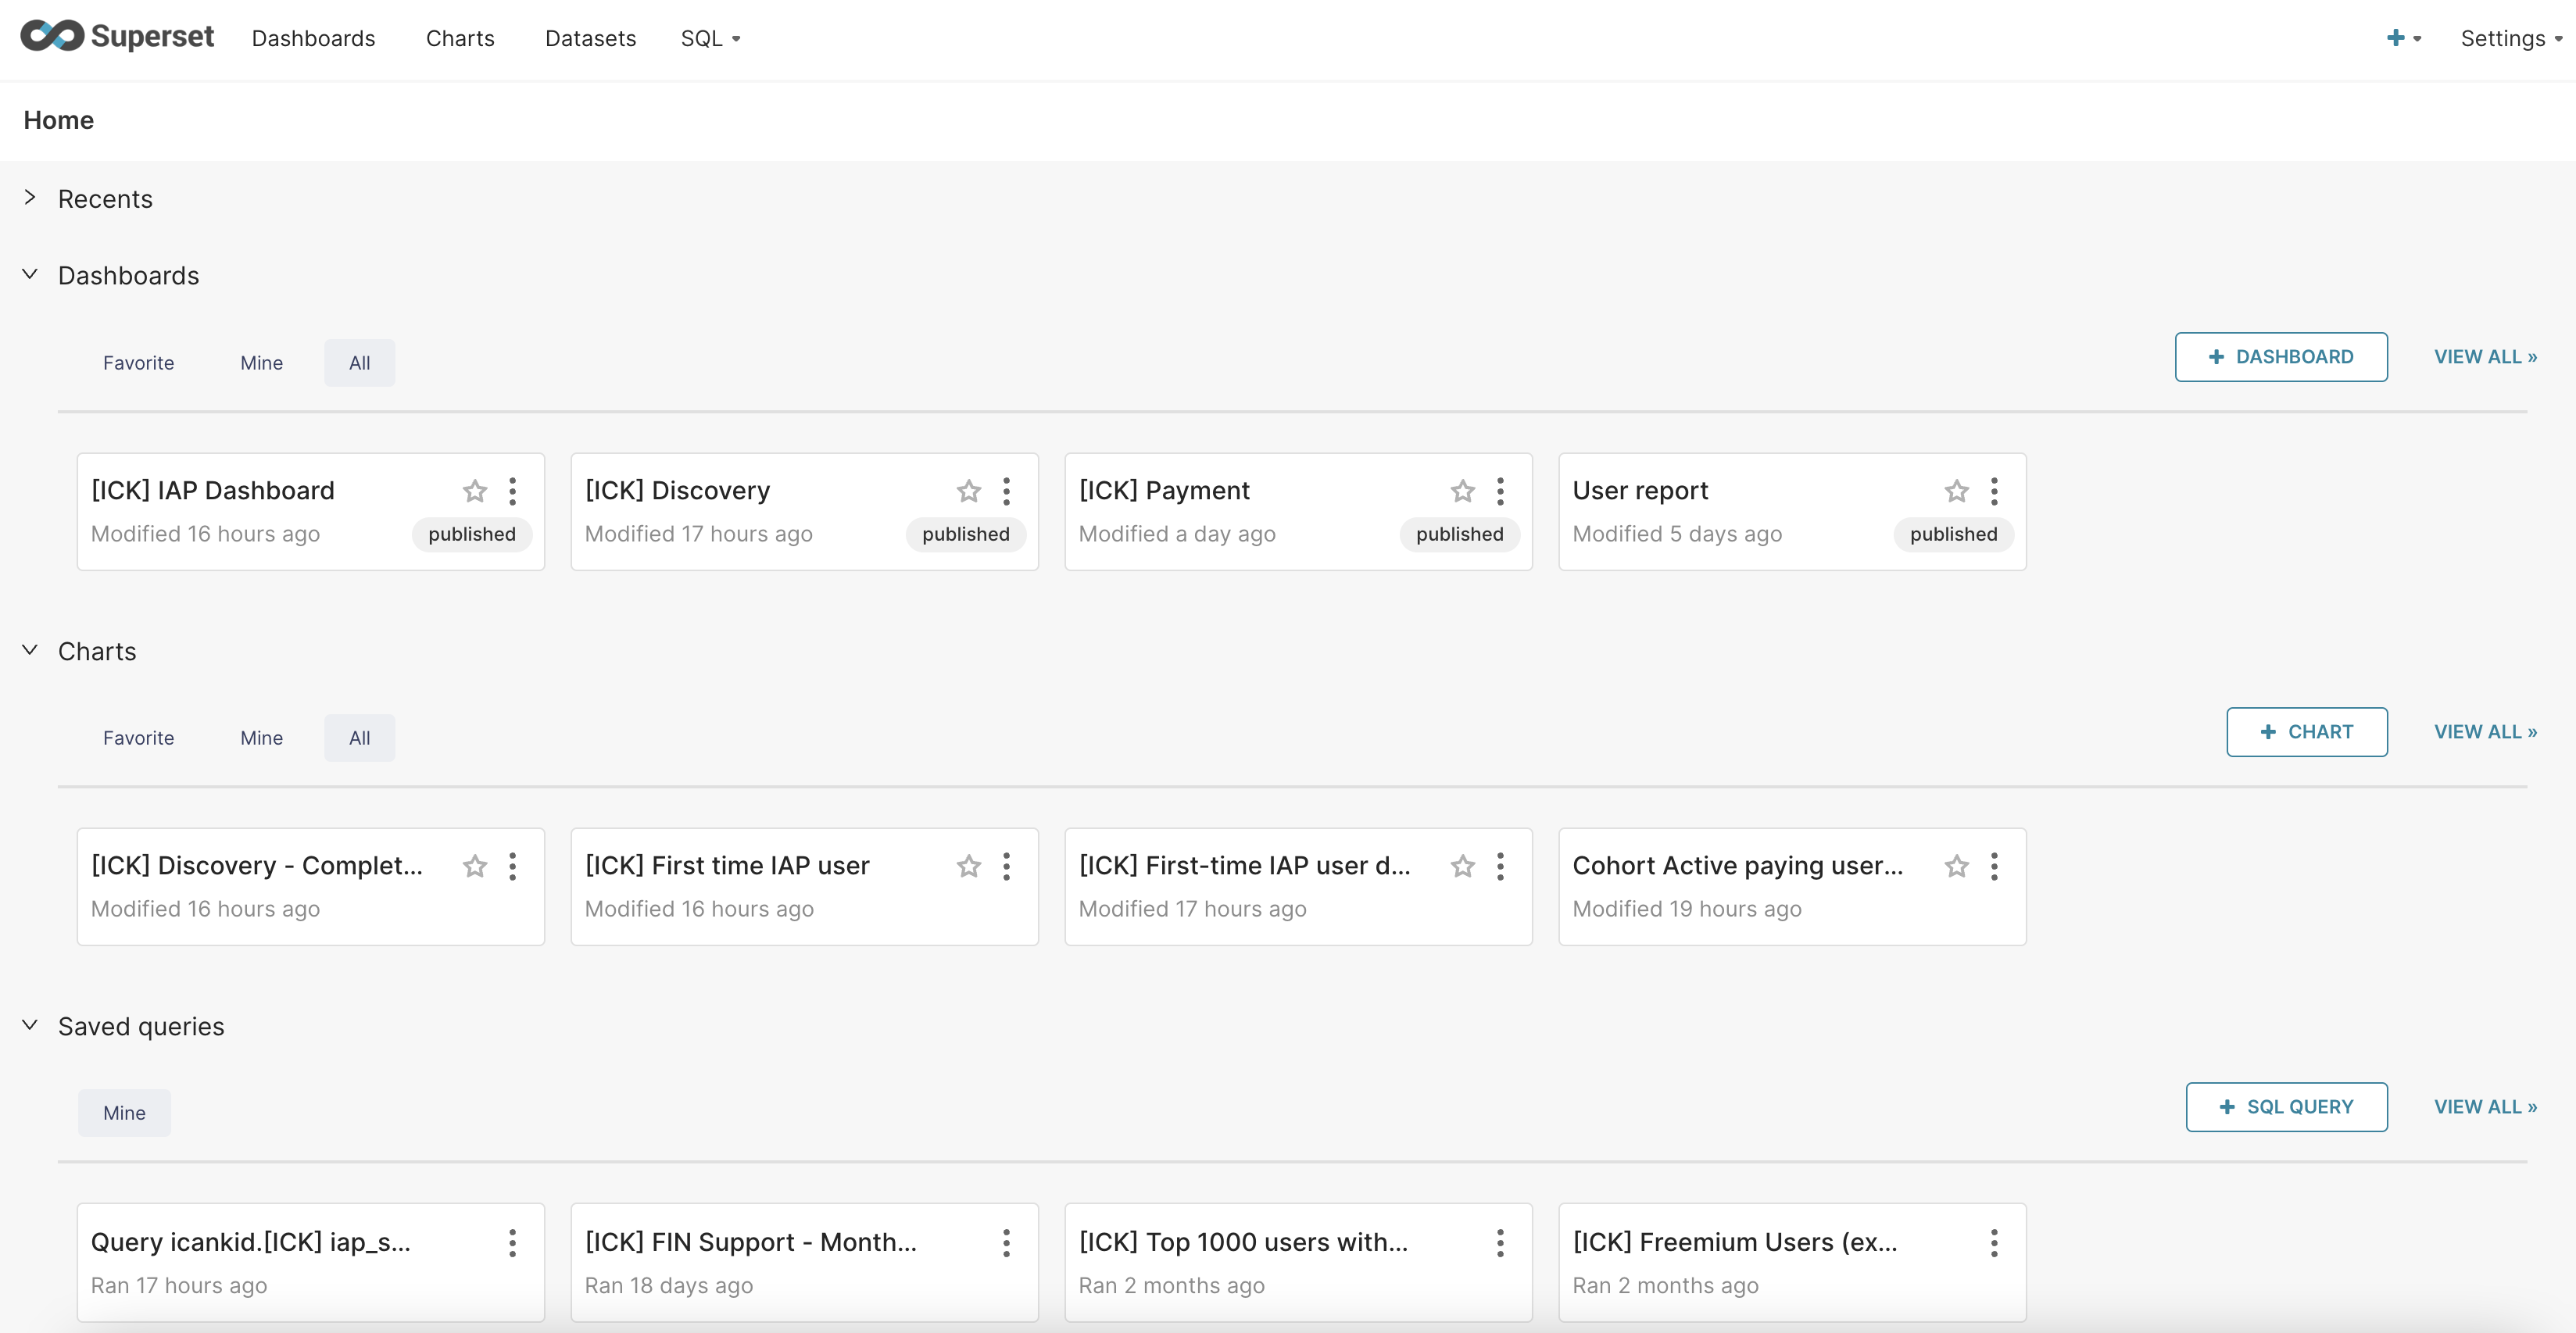
3. Dashboard
3.1. View
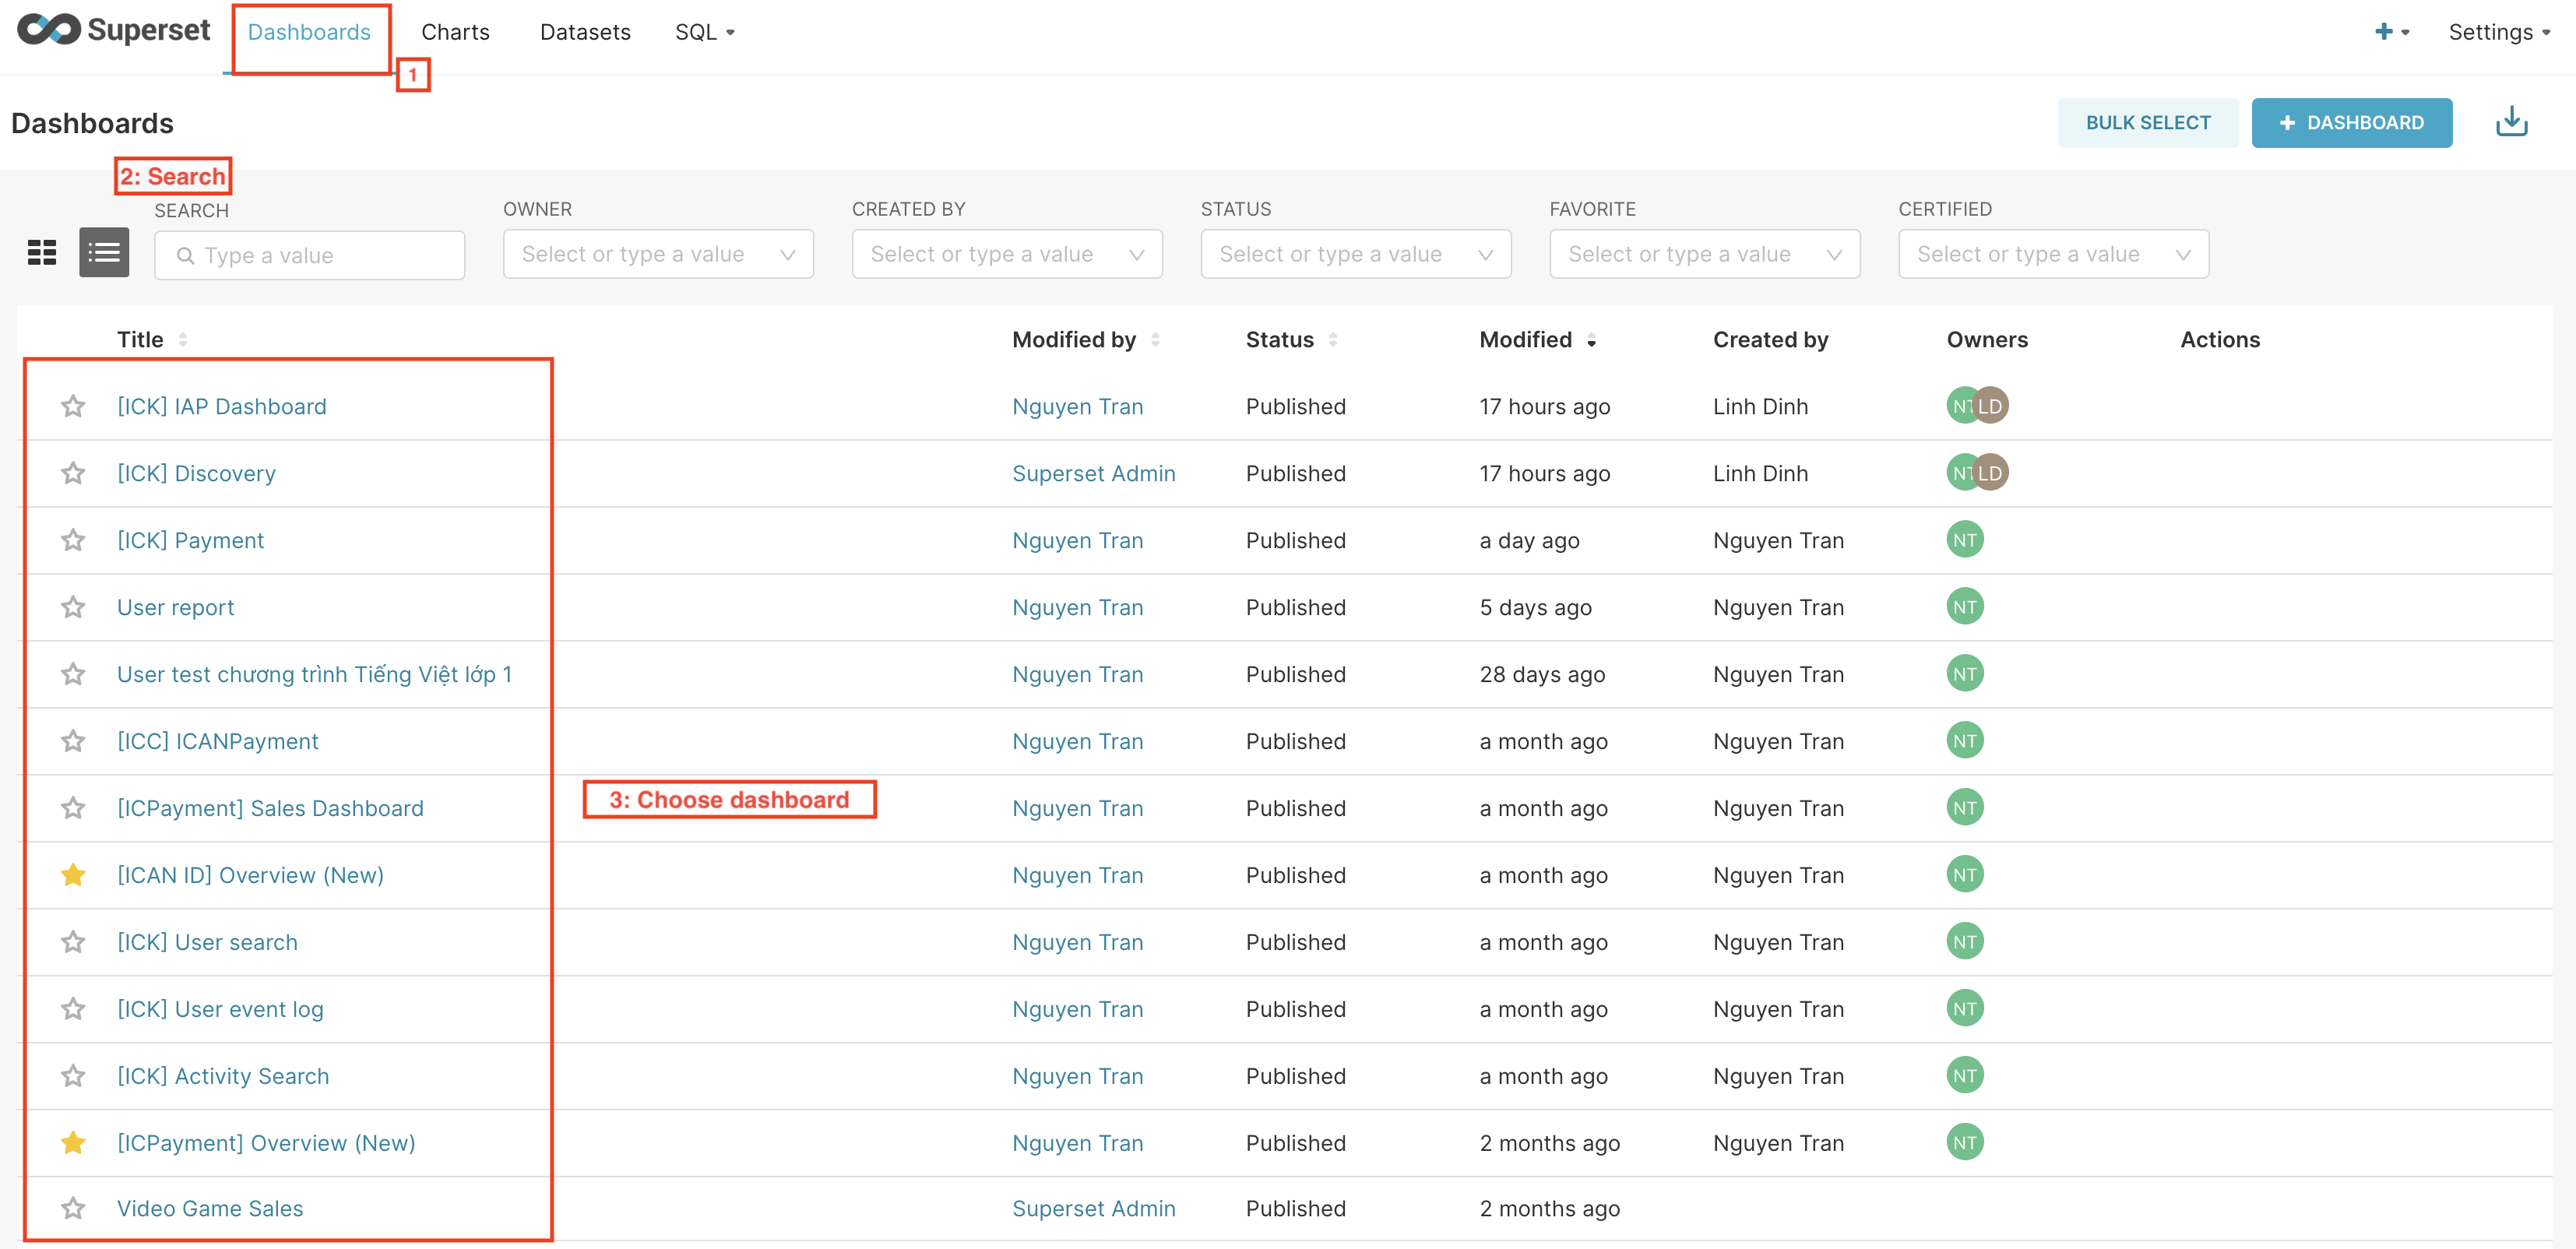
3.1.1. Choose dashboard
- Click dashboards on toolbar.
- Search title or filter by owner, created by, status,...
- Click Choose dashboard to view
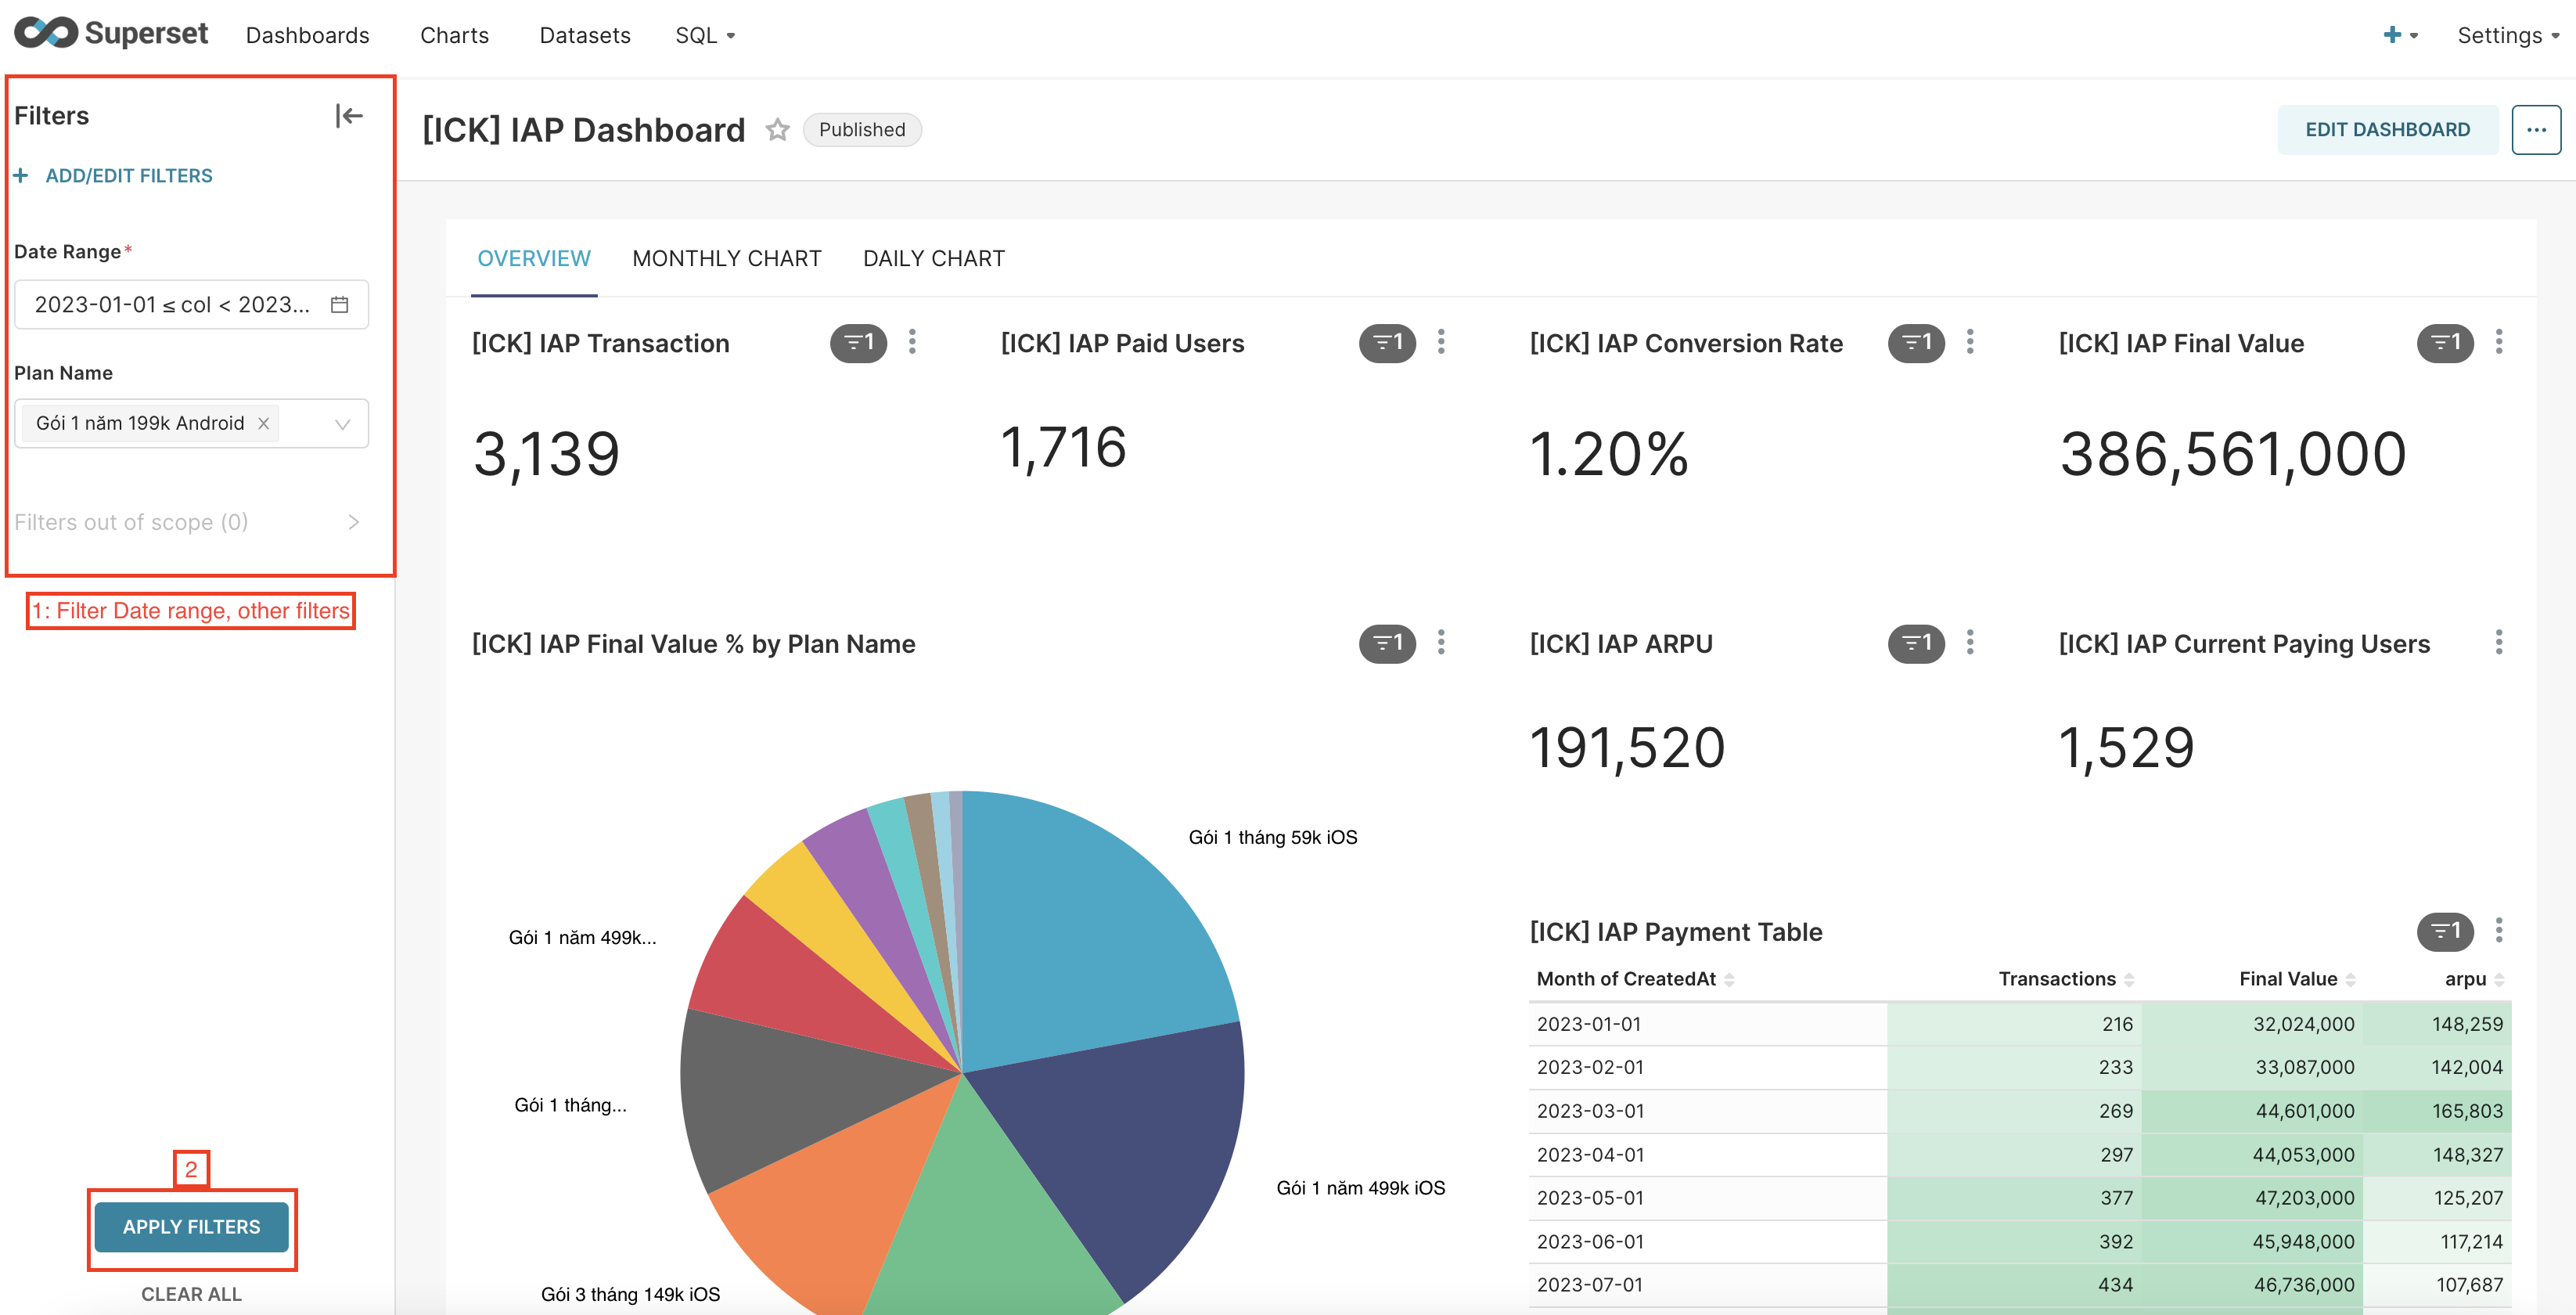
3.1.2. Filter
- After choose dashboard, select Filters on left-side bar
- Apply filters
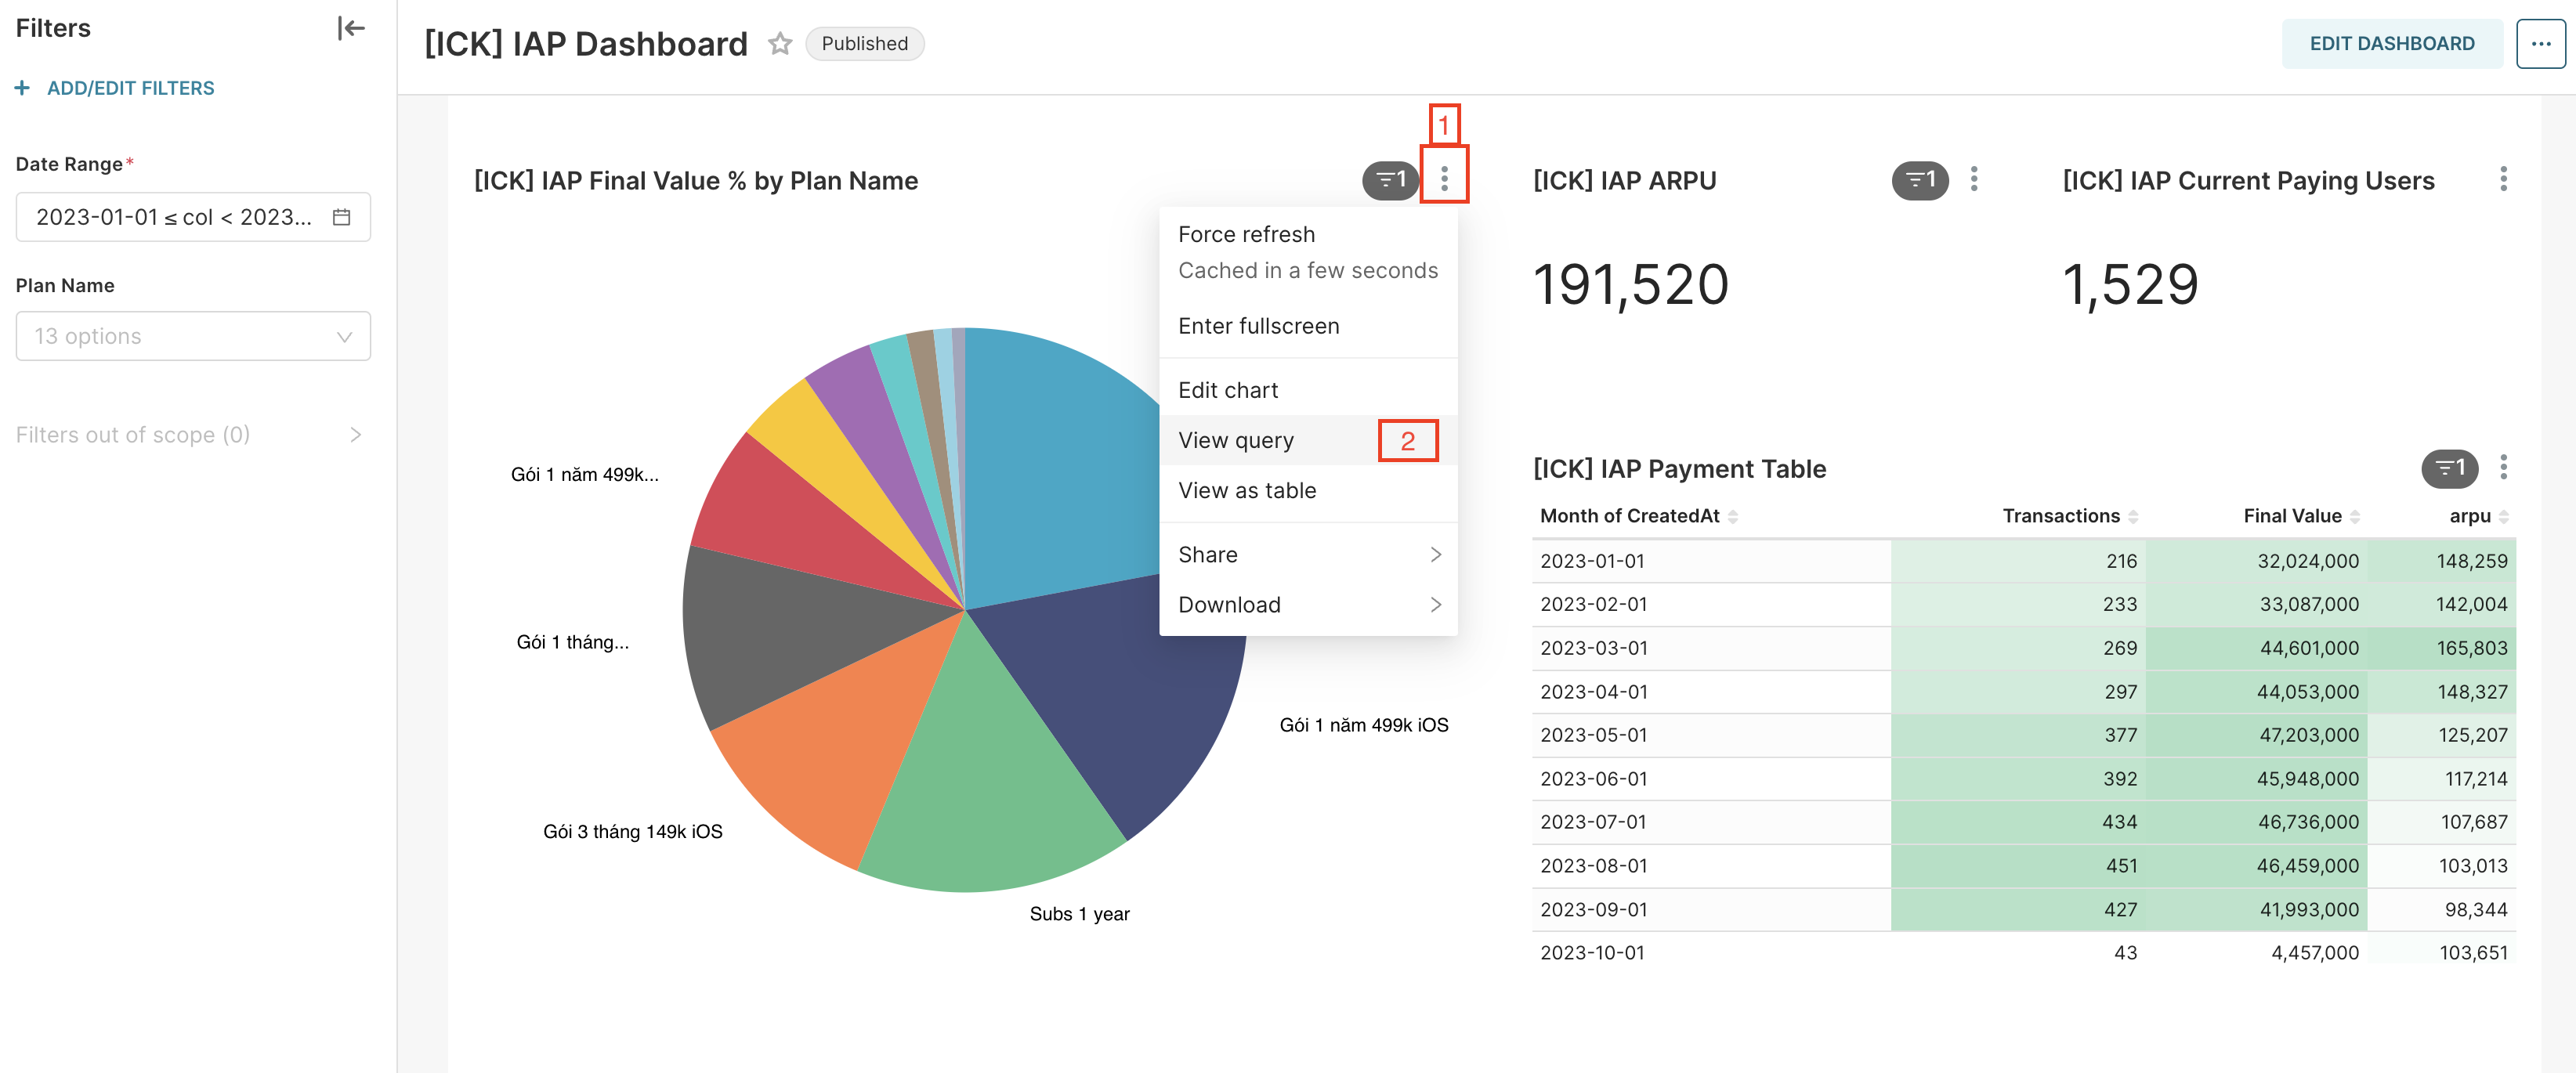
3.1.3. View query
On current dashboard, choose the chart → Click View query
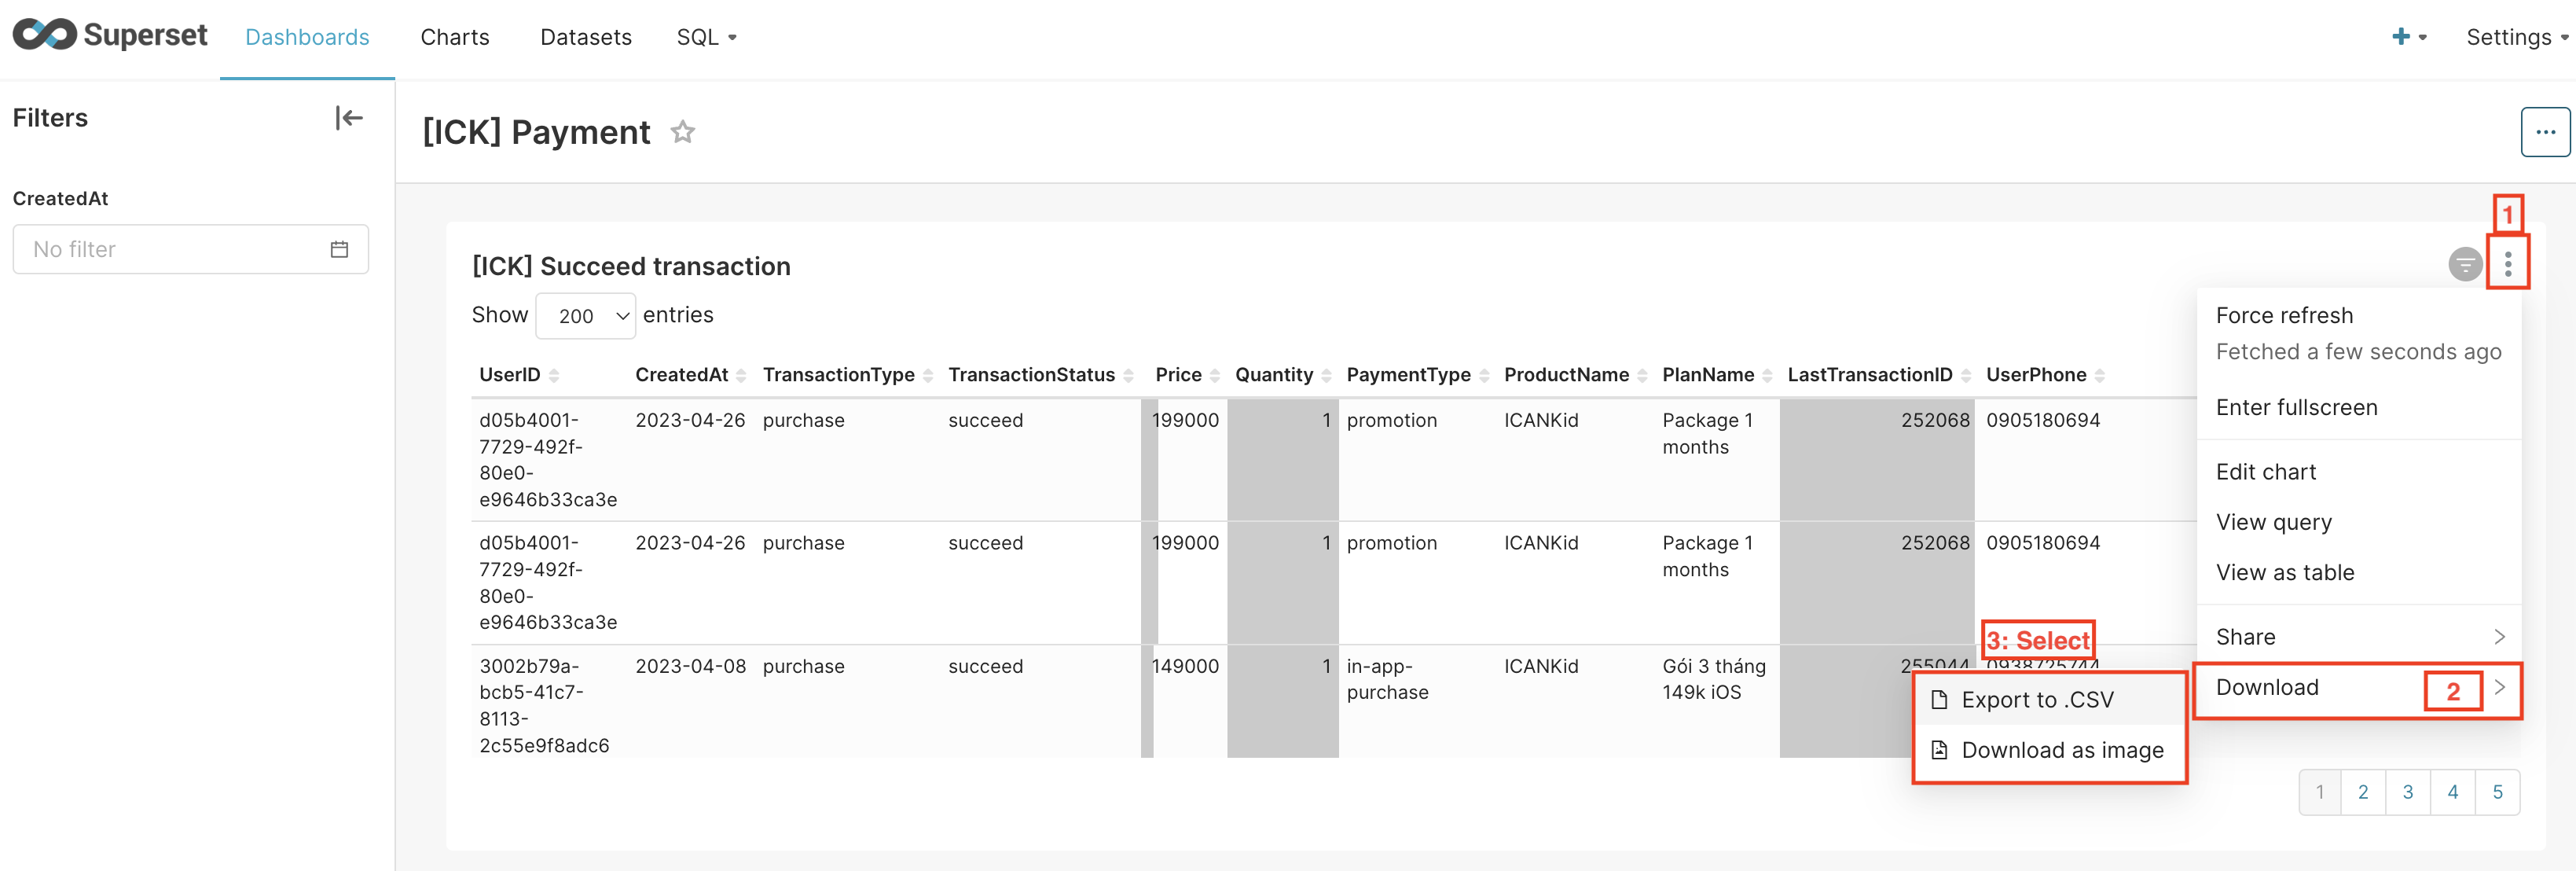
3.1.4. Download data from chart
- Choose the chart you would like to download
- Select Export to .CSV or Download as image
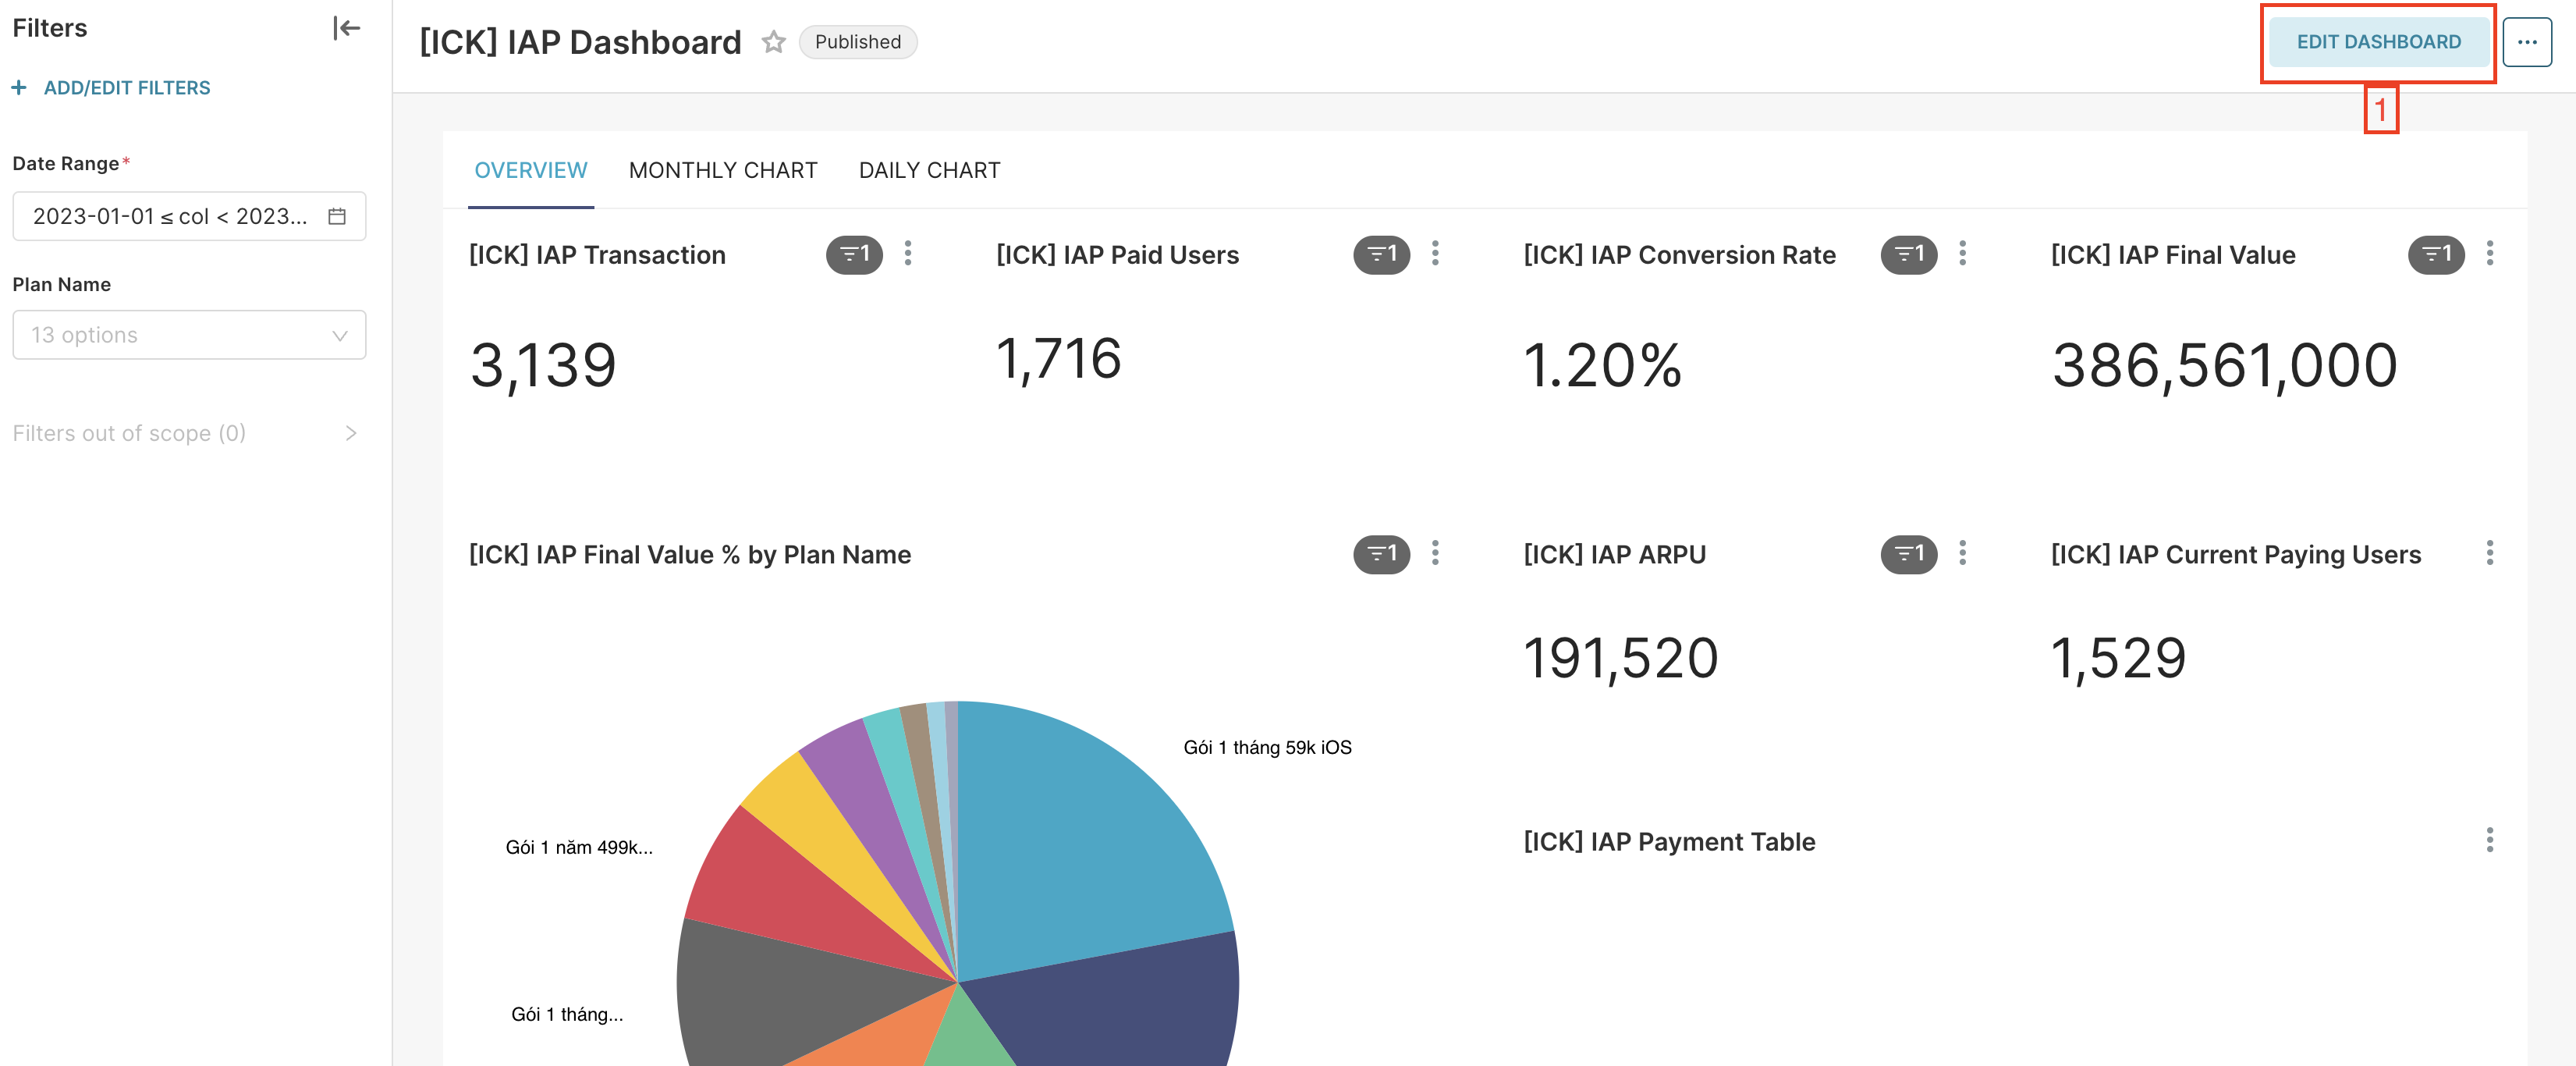
3.2. Edit
- Click button Edit dashboard
- Create, Edit, Delete charts
- Discard or Save

3.3. Create
- Click dashboards on toolbar
- Click button Add dashboard
- Set title dashboard, create new chart...
- Save
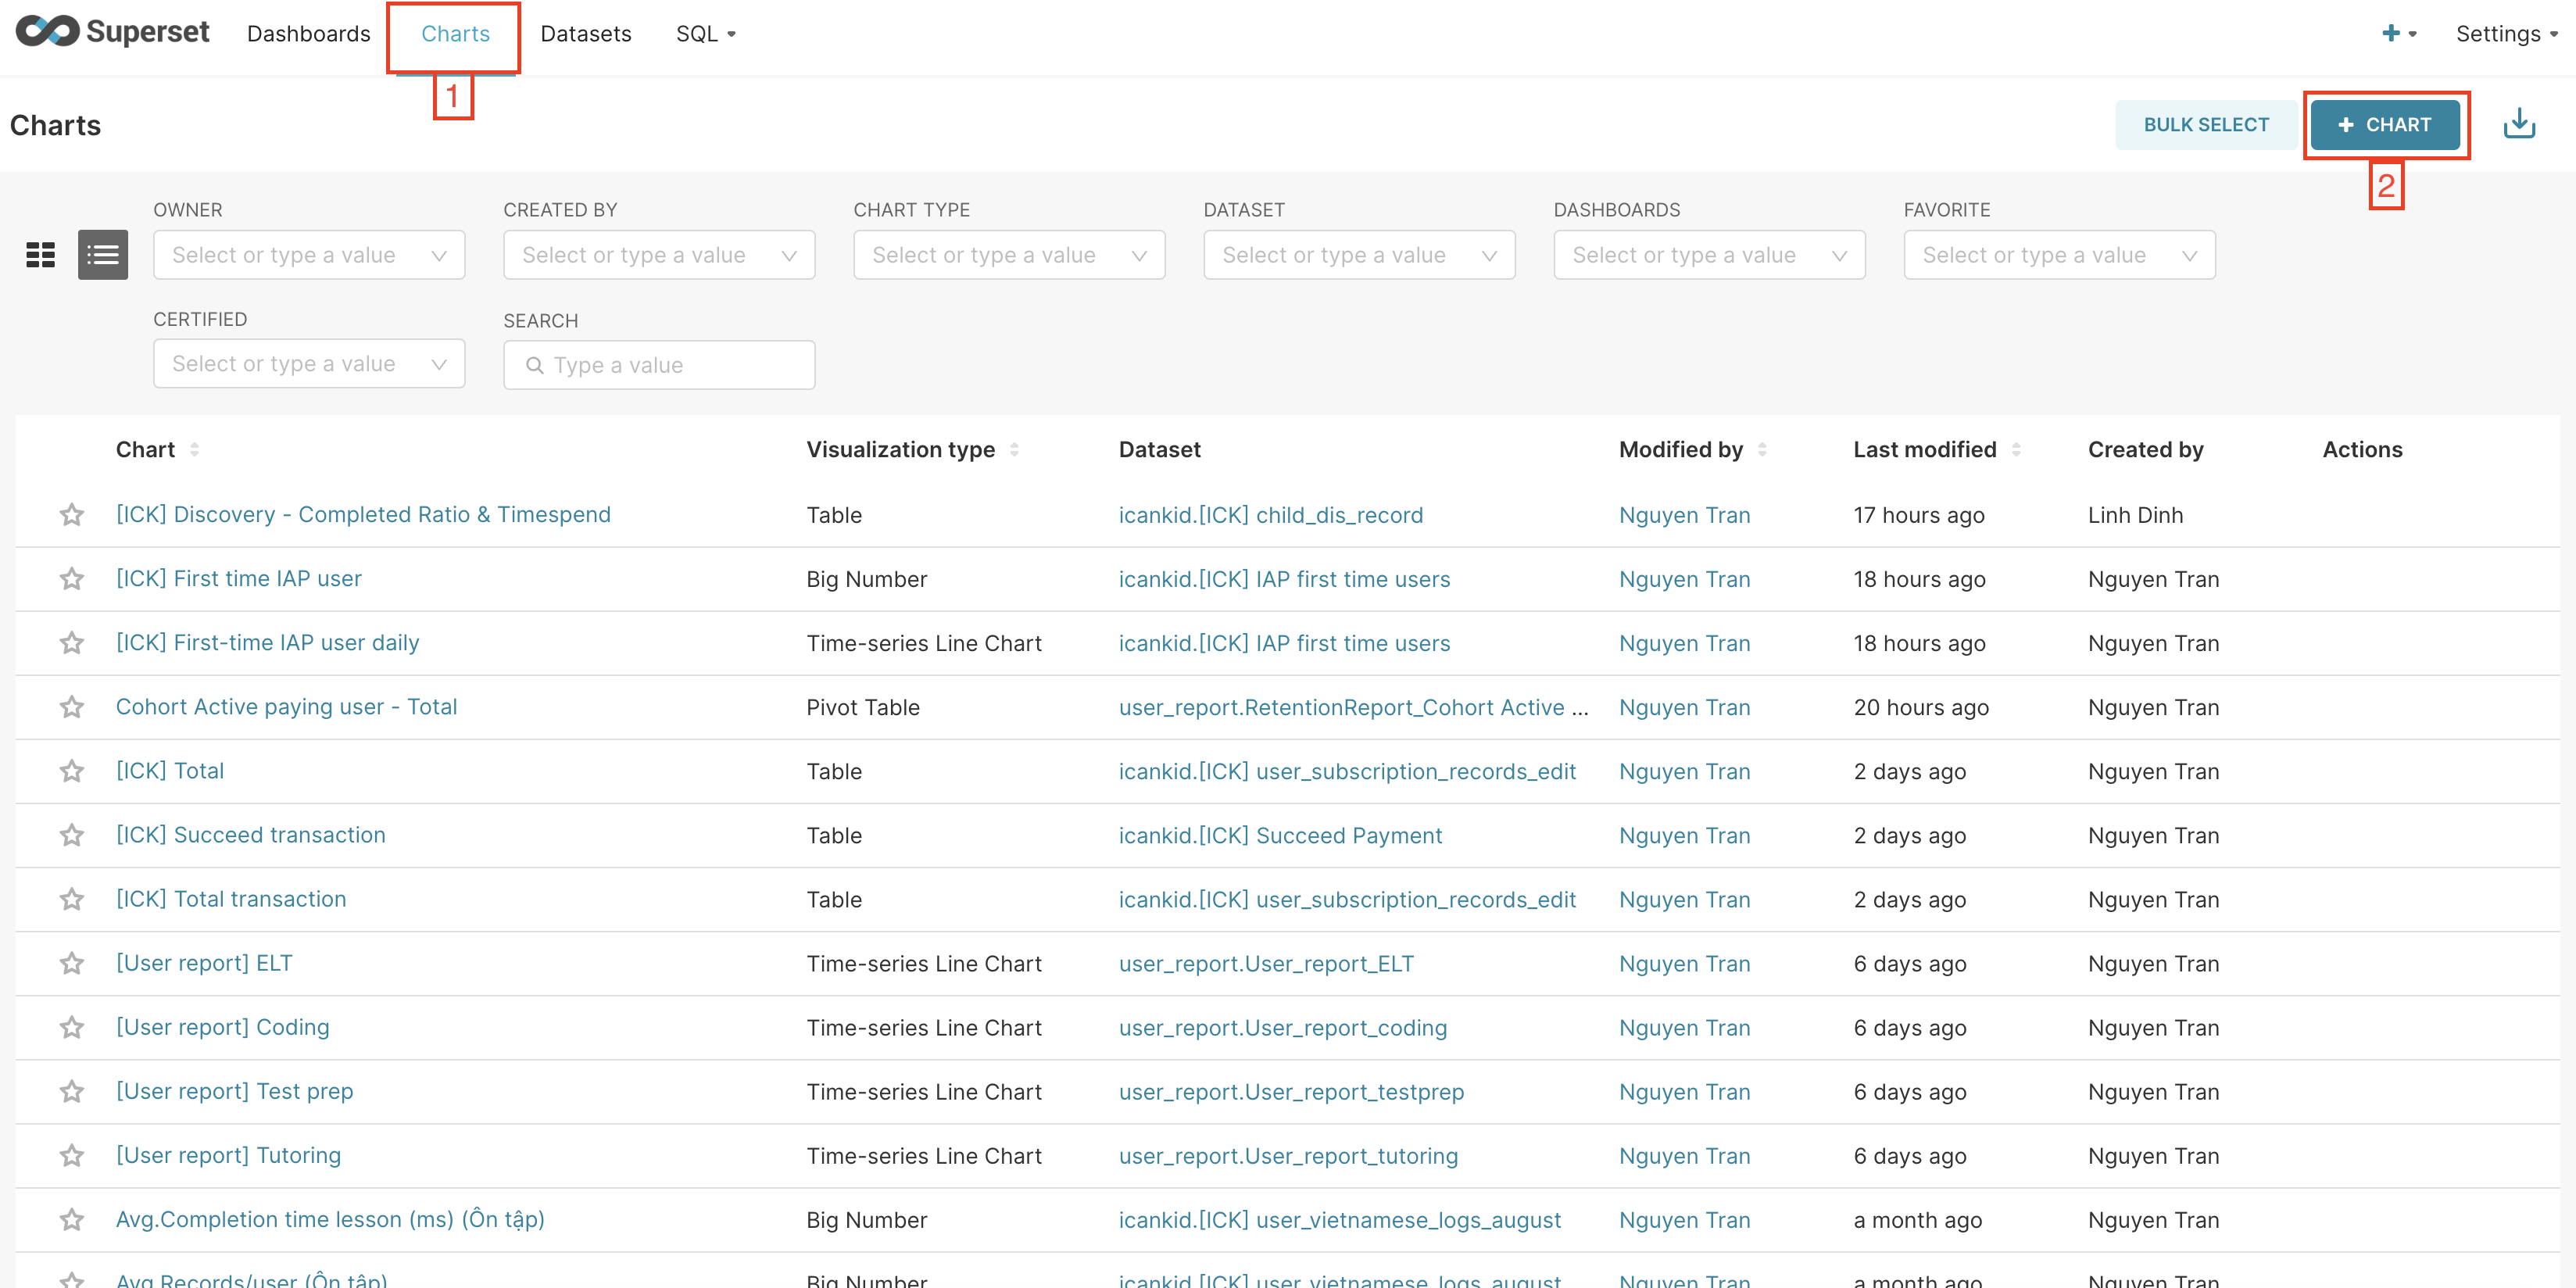
4. Chart
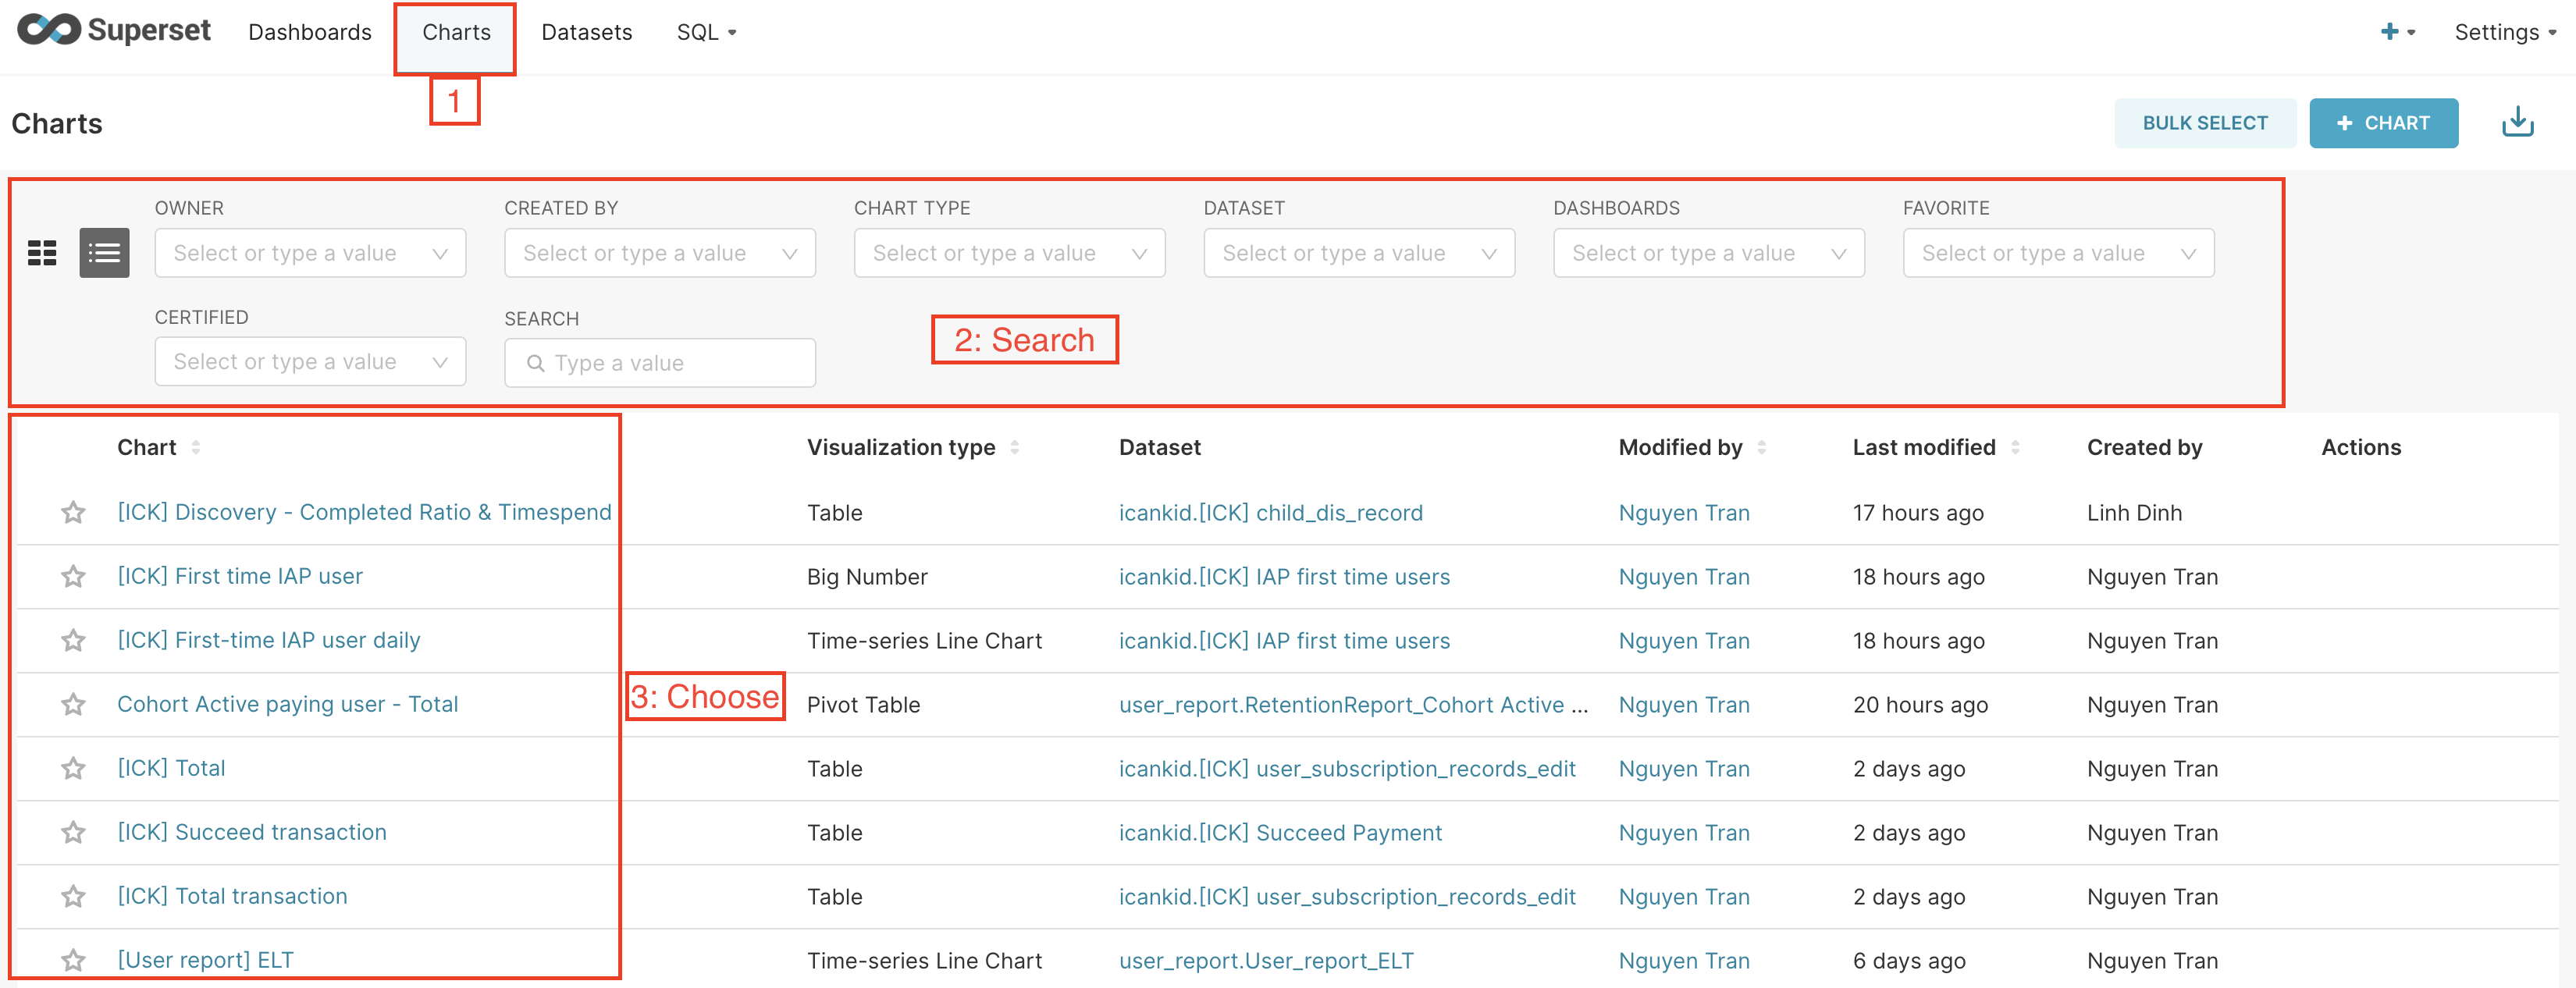
4.1. View
4.1.1. Choose chart
- Click Charts on toolbar
- Search or filter
- Choose chart you would like to view
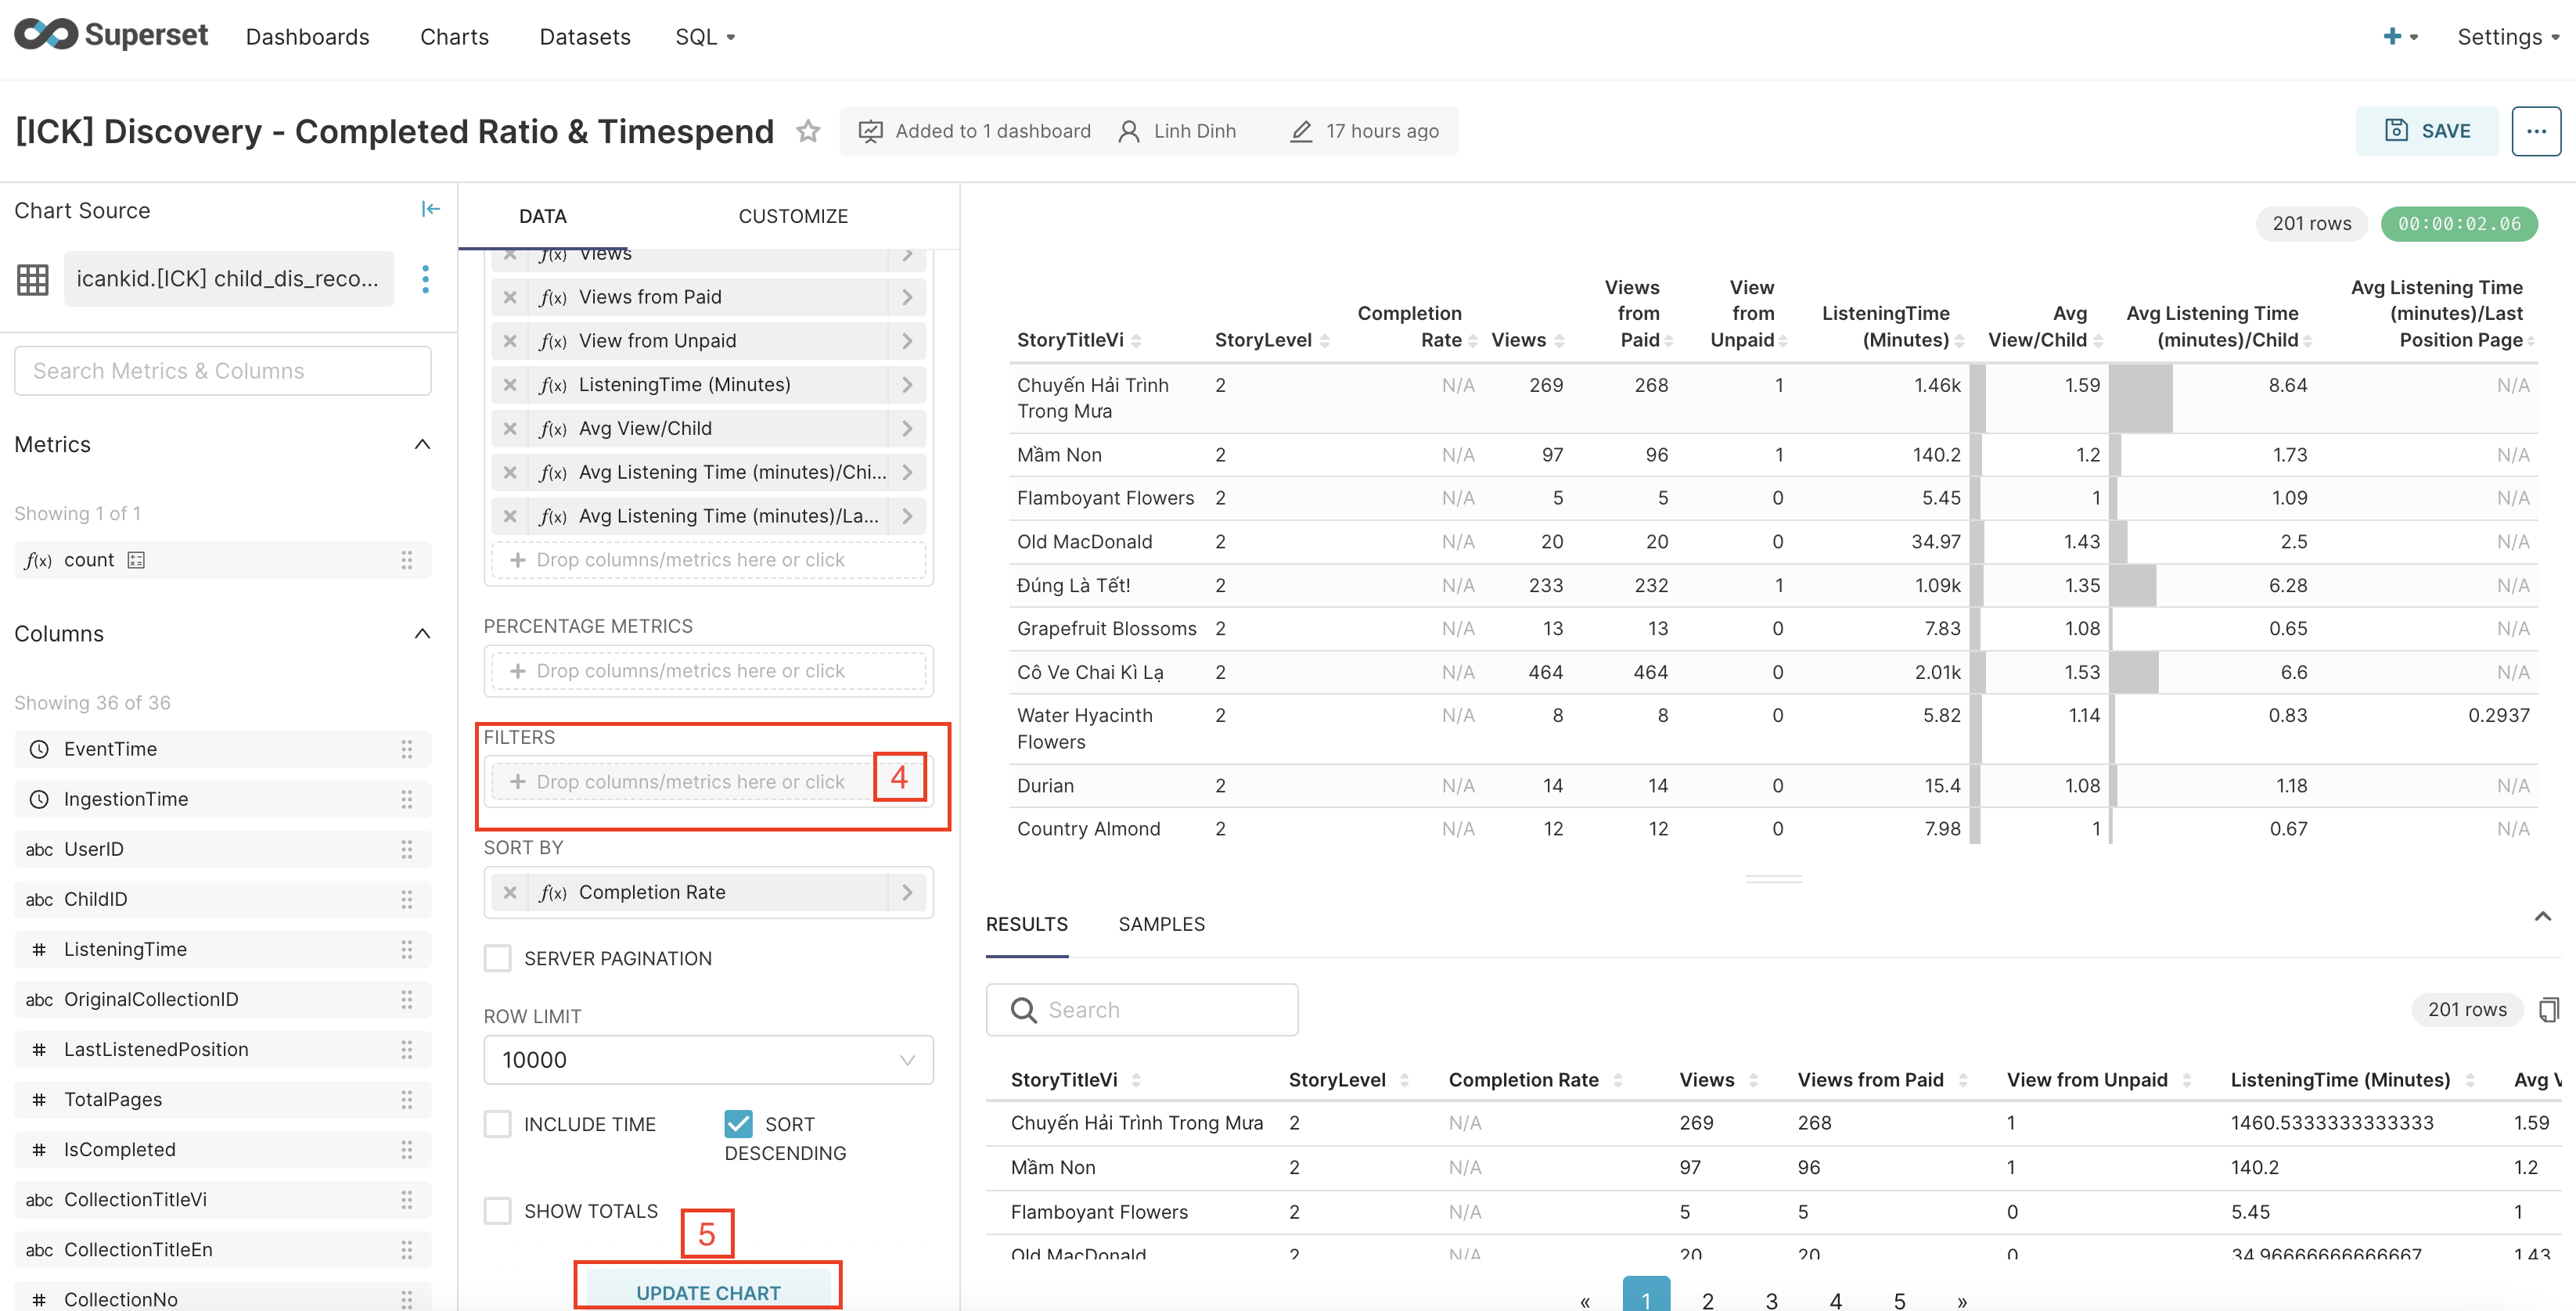
4.1.2. Filter
- Click box Time range
- Select range type
- Apply
- Select column at Filters
- Click button Update chart
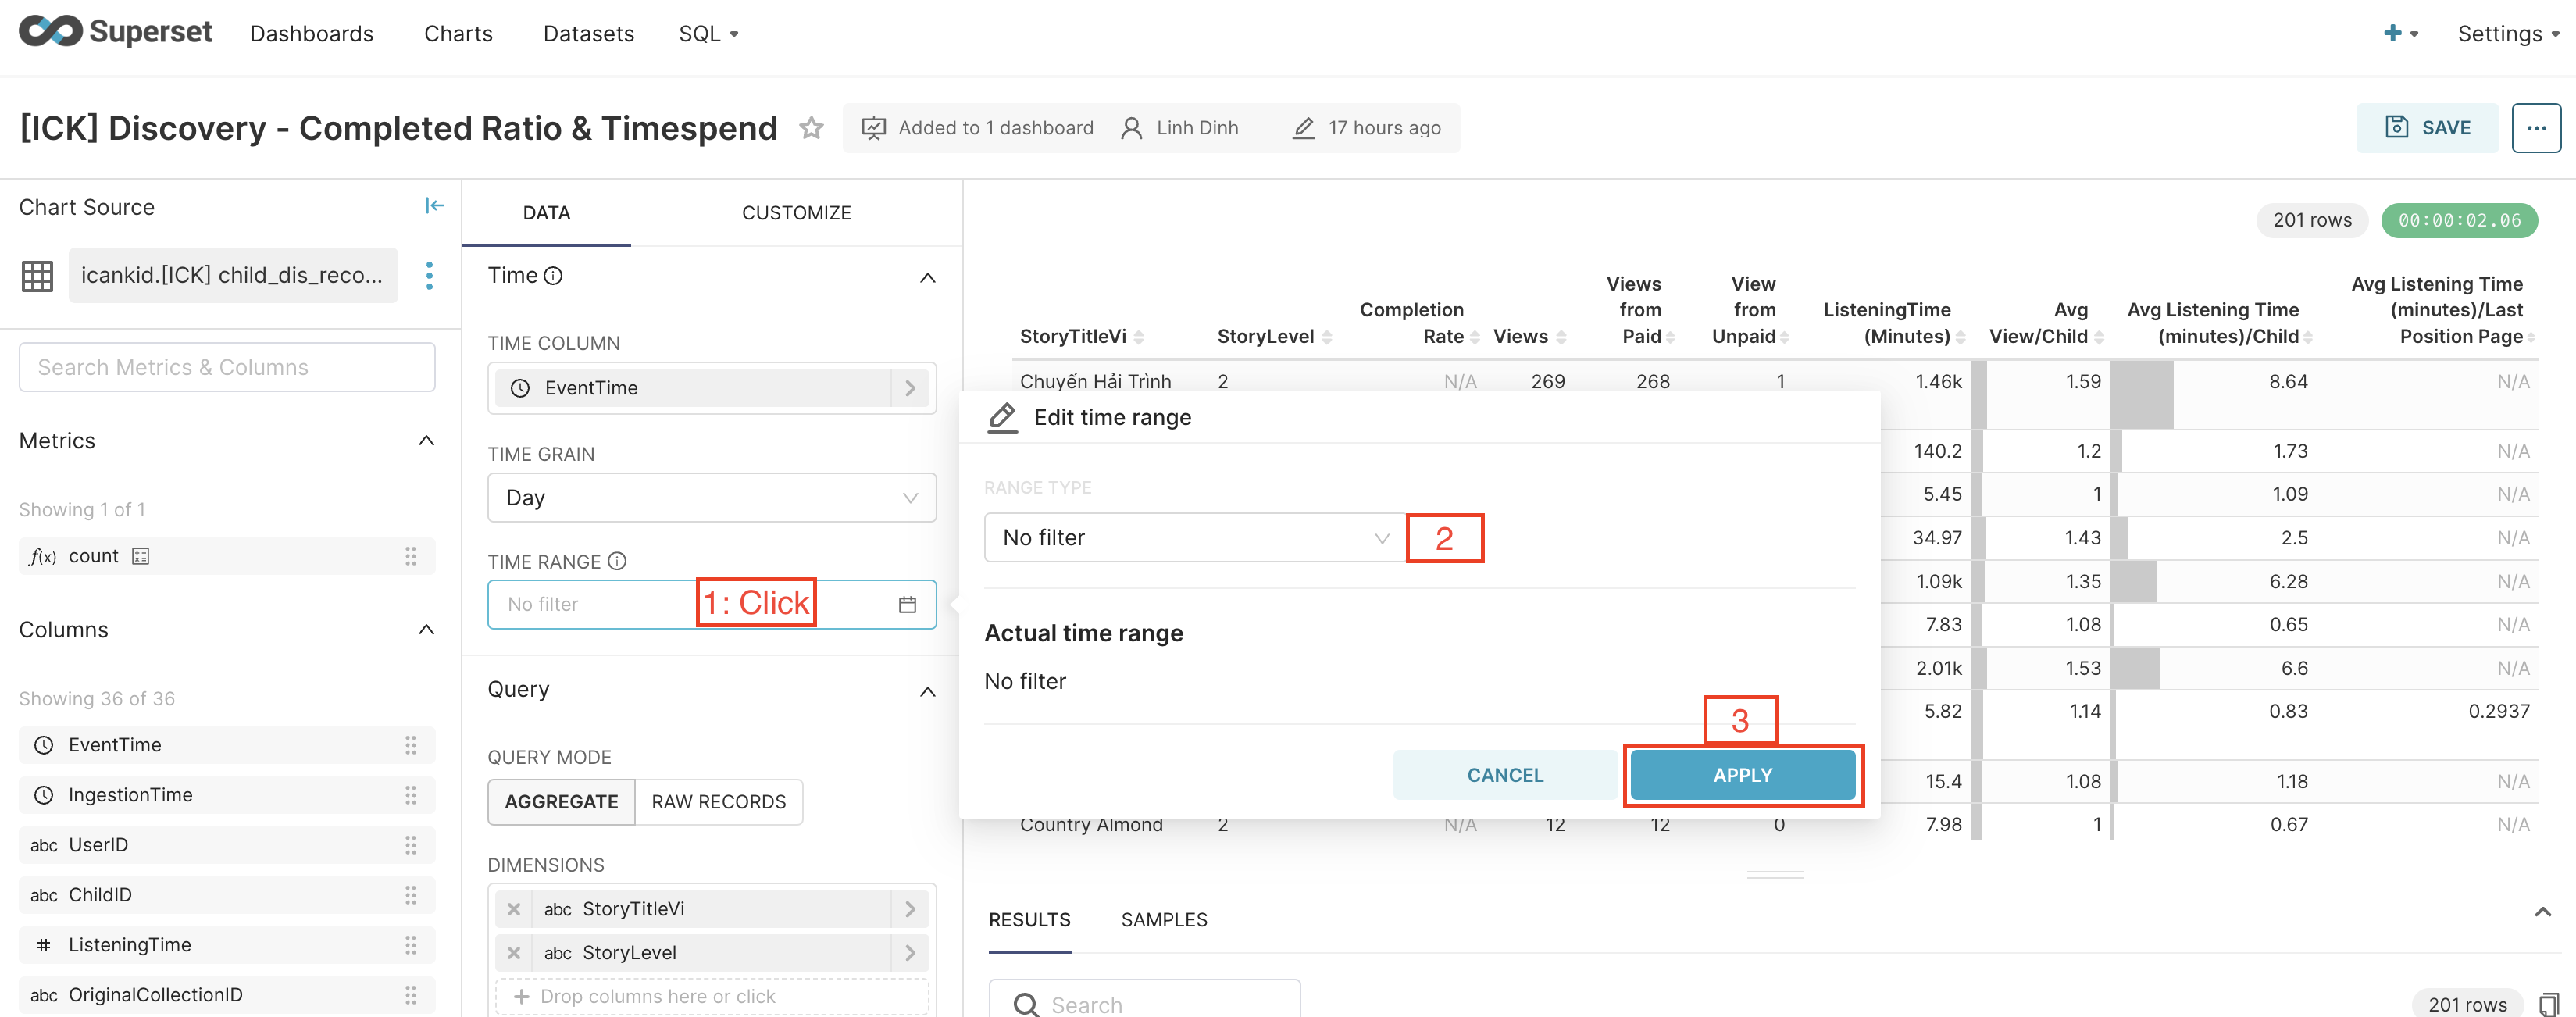
Note: Please do not save if you only want to view the chart.
4.2. Create
- Click Charts on toolbar
- Click button Add chart
- Choose a dataset
- Click button Create new chart
- Add name, time column, metrics, filters and customize
5. Query
- Click SQL on toolbar
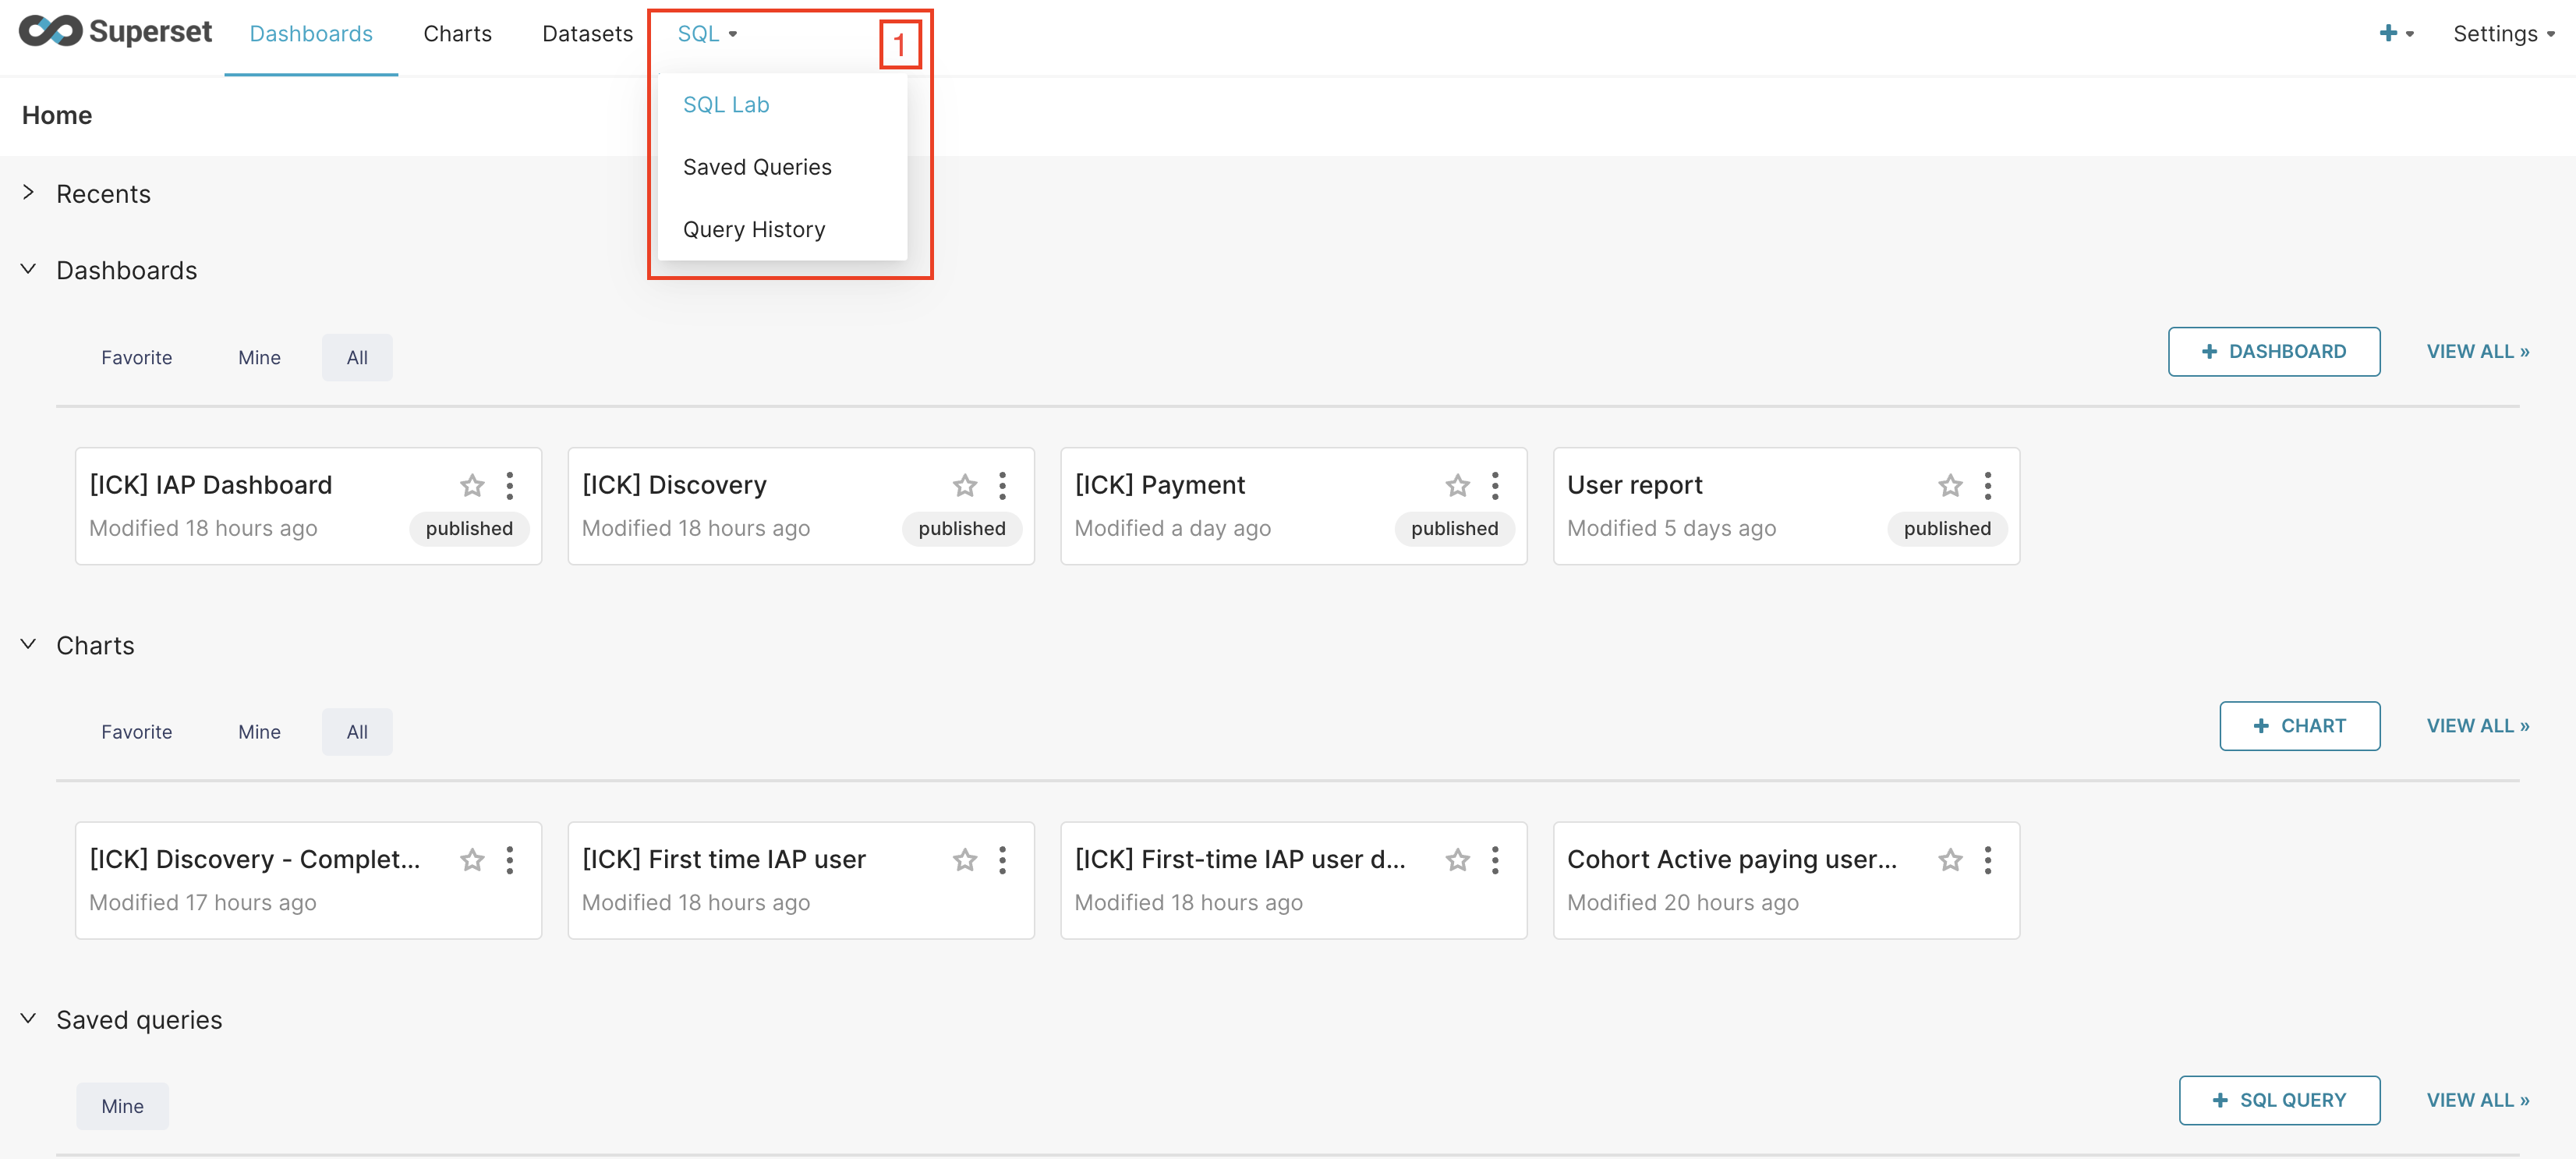
- Select database
- Select schema
- Write code SQL to get data
- Select limit
- Click button Run
Optional:
- Save query or Save dataset
- Select "See table schema" to Preview table
Database | Schema | Description |
CORE | icanid | merchant, users |
icanpayment | bank transfer, billing, transaction | |
subscription | Product plan | |
ICAN Kid | icankid | |
Report | user_report | cash in, paid user 4 BUs |
6. Considerations when querying
Given Superset's shared usage, it's crucial to optimize queries and datasets while creating dashboards to ensure a seamless experience for all users
Specify What You Need: Be clear about the data you need and only request the necessary fields to minimize the amount of data returned.
Avoid SELECT *: Avoid using
SELECT *as it retrieves all columns, which can be inefficient. Instead, explicitly list the columns you need.Filter Early: Apply filters and conditions early in your query to reduce the dataset size before any complex operations are performed.
Use Joins Wisely: Be mindful of how you use joins, as they can be resource-intensive. Use INNER JOIN, LEFT JOIN, etc., as appropriate for your data relationships.
Aggregate Smartly: When performing aggregations, consider the efficiency of GROUP BY and aggregation functions like COUNT, SUM, AVG, etc.
Limit Results: Use the LIMIT clause to restrict the number of rows returned, especially when working with large datasets.
Monitor Performance: Regularly monitor query performance, identify bottlenecks, and optimize slow queries.
Avoid Nested Subqueries: Be cautious when using nested subqueries, as they can be complex and impact performance.
Consider Data Types: Be aware of data types and conversions when filtering or manipulating data.
Caching: Implement caching for frequently used queries to reduce database load.
Add Comment